
Towards a Western Canada Growth Strategy
View the print-friendly version: PDF
Introduction
The new global economy is transforming the way entrepreneurs operate their businesses. In fact, changes in today's competitive landscape are driving businesses to rethink their strategies to reach beyond traditional boundaries.
This is why the Government of Canada welcomes your input on the future of western Canada's economy. Together, we will develop a Western Canada Growth Strategy that will help lay the foundation for our long-term success five years from now, ten years from now, and beyond.
This engagement paper seeks public input to help develop the most effective strategy for economic growth. It is important that the views of those most directly involved help shape the foundation of this Western Canada Growth Strategy.
Because there is strength in diversity, this engagement paper invites input from:
- industry;
- businesses;
- different levels of government;
- rural communities;
- First Nations, Inuit, Métis and organizations;
- women, youth, and new immigrants;
- economic development organizations;
- innovation centres;
- think tanks and academia; and
- individual Canadians.
At its core, the strategy is about growing the economy, attracting investment, and creating middle class jobs for Canadians. To do this, we need to think boldly and work together to focus our efforts on advancing western Canada's regional strengths.
Table of Contents
- Introduction
- What is the current regional landscape ?
- Demographics: Young, Diverse, Growing
- First Nations, Inuit and Métis in the West: Helping to Grow the Indigenous Economy
- Gross Domestic Product (GDP): Growth and Stability
- Labour Market: Sustainable and Inclusive
- Trade: Diversifying Products and Markets
- Natural Resources: Abundant, Responsible, Competitive
- SMEs and Entrepreneurship: Strengthening our Business Culture
- Innovation: Translating Ingenuity into Growth
- Skills: Preparing for the Future
- Ways to share your ideas
- Five questions
What is the current regional landscape?
Over the past two decades, western Canada's strengths have helped drive national economic growth. In fact, in 2017, the regional economy reached $651 billion.
That is 38% of Canada's total economy
However, to remain successful, we cannot rest on our past achievements.
We need to understand how western Canada can better grow the economy, attract new investment, and create middle- class jobs.
On the pages that follow, you will find nine one-page primers on the following key aspects of the western Canadian economy:
- Demographics;
- First Nations, Inuit and Métis;
- Real GDP;
- Labour Market;
- Trade;
- Natural Resources;
- SMEs and Entrepreneurship;
- Innovation; and
- Skills.
This engagement paper seeks your ideas and recommendations to create a powerful growth strategy for western Canada. At the end of this paper are instructions for you to share your input.
Use these primers to give you context for your recommendations, so that we can succeed together.
Western Canada is home to:

The four fastest-growing provincial populations.

55% of Canada's Indigenous Peoples and over half of Canada's Indigenous entrepreneurs.

Three tech unicorns: Slack, Hootsuite, Avigilon.

427,000 active small businesses that employ over 3.4 million people.

The world's third-largest uranium reserves, and oil reserves.

Five of the top research-intensive universities.

The highest employment rates in the country.

Almost 400,000 Science, Technology, Engineering, and Mathematics (STEM) graduates.
Demographics
Young, Diverse, Growing
Western Canada is home to…
- 32% of Canada's population (11.1 million)
- 55% of Canada's Indigenous population (First Nations, Métis, and Inuit)
- The fastest-growing provincial populations in Canada
Share of Total Population by Age, Census 2016

Text version
The bar graph shows the proportion of the population divided into age ranges for Western Canada compared to the Rest of Canada. The proportion of Western Canadians aged 25-39 years is approximately two percentage points higher than the same age range for the Rest of Canada. Additionally, the proportion of the Rest of Canada in the 50-59 years age range is higher compared to Western Canada.
| Age | Western Canada (%) | Rest of Canada (%) |
|---|---|---|
| 0-4 | -5.23 | 5.78 |
| 5-9 | 5.62 | 6.00 |
| 10-14 | 5.4 | 5.62 |
| 15-19 | 5.72 | 5.85 |
| 20-24 | 6.39 | 6.37 |
| 25-29 | 6.27 | 7.02 |
| 30-34 | 6.32 | 7.30 |
| 35-39 | 6.39 | 6.78 |
| 40-44 | 6.38 | 6.50 |
| 45-49 | 6.76 | 6.62 |
| 50-54 | 7.79 | 7.25 |
| 55-59 | 7.59 | 7.16 |
| 60-64 | 6.63 | 6.27 |
| 65-69 | 5.79 | 5.22 |
| 70-74 | 4.23 | 3.63 |
| 75-79 | 3.03 | 2.63 |
| 80-84 | 2.22 | 1.95 |
| 85+ | 2.25 | 2.06 |
Did you know....
- The west has Canada's six fastest growing cities: Calgary, Edmonton, Saskatoon, Regina, Lethbridge, and Kelowna.
- 494,490 new immigrants moved to the west between 2011-2016, representing nearly 5% of its population.
- The western provinces all have above-average population growth.
Challenges and opportunities
- Western Canada has an increasingly diverse and young pool of talent ready to take on the jobs of the future.
- The population is spread over more than 2.7 million square kilometres, including unique rural and remote communities.
- Western Canada has had the highest number of recent natural disasters of any region in Canada, significantly affecting communities across the region.
A Young Population
- Alberta, Saskatchewan, and Manitoba's populations are three years younger on average than Canada as a whole, while British Columbia's is 1.5 years older.
- Half are under the age of 40 years.
- The average age of the Indigenous population is more than 10 years younger than for non-Indigenous.
- The west's youth population is projected to grow twice as fast as Canada's.
Metropolitan Area Growth Rates (2011-2016)

Text version
The map displays the population growth of Western Canadian cities as a percentage from 2011-2016.
| City | Percentage of population growth |
|---|---|
| Edmonton | 13.9 |
| Saskatoon | 12.5 |
| Victoria | 6.7 |
| Vancouver | 6.5 |
| Kelowna | 8.4 |
| Calgary | 14.6 |
| Lethbridge | 10.8 |
| Regina | 11.8 |
| Winnipeg | 6.6 |
Want to learn more?
Population size and growth in Canada: Key results from the 2016 Census, Statistics Canada
Aboriginal peoples in Canada: Key results from the 2016 Census, Statistics Canada
Immigration and ethnocultural diversity: Key results from the 2016 Census
Source: Statistics Canada, Public Safety
First Nations, Inuit and Métis in the West
Helping to Grow the Indigenous Economy
Western Canada is home to...
- More than half of Canada's First Nations People (57%) and total Indigenous population (55%)
- A young Indigenous population, 47% are under the age of 25 years
- 57% of Canada's First Nations population
Landscape
- Nearly 60% of western Canada's Indigenous population reside in British Columbia (29.2%) and Alberta (27.9%), with a smaller share in Manitoba (24.1%), and Saskatchewan (18.9%).
- 24% of Indigenous Peoples in the west live on reserve.
- The western Indigenous population includes more than 550,000 First Nation, 350,000 Metis, and 5,000 Inuit.
- Since 2006, the region's Indigenous population has grown by 32.6%, more than double the growth rate of the non- Indigenous population.
Challenges and opportunities
- Saskatchewan and Alberta had the highest Indigenous unemployment rates outside of Atlantic Canada and the Northern Territories.
- Indigenous individuals living on reserve are almost twice as likely to not have a high school diploma as those living off reserve.
- Closing the education and training gaps between Indigenous and non-Indigenous populations could result in billions of dollars of additional income earned by the Indigenous workforce.
- The size of Canada's Indigenous market was estimated to be about $30 billion in 2016.
- From 2006 to 2016, the number of Indigenous self-employed workers in the west grew by 46%.
- Indigenous economic development and business organizations, such as Council for the Advancement of Native Development Officers, National Aboriginal Capital Corporations Association, and the Tulo Centre, are offering specialized training resources for Indigenous communities and businesses.
Western Canadian Indigenous Population (2016)

Total Indigenous: 927,550
Text version
The pie chart shows the identities of the Indigenous population in Western Canada in 2016 as a percentage. The total Indigenous population in Western Canada in 2016 was 927,550.
| Inuk(Inuit) (%) | Multiple & Other identities (%) | First Nation (%) | Metis (% | Total (#) |
|---|---|---|---|---|
| 0.5 | 1.9 | 59.7 | 37.8 | 927,550 |
Did you know...
- Canada is committed to a renewed nation-to-nation relationship with Indigenous Peoples, based on recognition of rights, respect, co-operation, and partnership.
- The Indigenous Peoples in the west also have different legal standings based on their identity: First Nations as per the Indian Act, Métis and Inuit as per section 35 of the Constitution Act of 1982, and the United Nations Declaration of Indigenous Rights of 2006.
Want to learn more?
Reconciliation Growing Canada's Economy by $27 Billion
Aboriginal peoples in Canada: Key results from the 2016 Census, Statistics Canada
The Long and Winding Road Towards Aboriginal Economic Prosperity
Source: Statistics Canada, TD Economics, National Aboriginal Economic Development Board
Gross Domestic Product (GDP)
Growth and Stability
Western Canada is home to…
- Diverse economies that create nearly 38% of Canada's real GDP
- Some of the highest GDP growth rates in Canada
- Per-capita GDP that is 18% higher than the national level
Provincial Real GDP Growth Forecast (Based on Average of Private Sector Projections)

*projected forecast
Text version
The bar graph shows the real GDP growth for the four western provinces for 2017 and the projected forecasts for 2018 and 2019.
| Province | 2017 GDP growth (%) | Projected 2018 GDP growth (%) | Projected 2019 GDP growth (%) |
|---|---|---|---|
| British Columbia | 3.9 | 2.4 | 2.0 |
| Alberta | 4.9 | 2.3 | 2.2 |
| Saskatchewan | 2.9 | 1.8 | 2.3 |
| Manitoba | 2.9 | 1.9 | 1.4 |
*projected forecast
Want to learn more?
Provincial Outlook Executive Summary, Conference Board of Canada
TD Provincial Economic Forecast
West is best once again (Financial Post)
GDP growth
- Alberta and British Columbia were Canada's fastest growing provinces in 2017.
- More moderate rates of economic growth are expected across all western provinces over the next two years.
Did you know...
- Western Canada accounts for 37.6% of Canadian real GDP, with only 32% of the population.
- Alberta and Saskatchewan have the highest GDP per capita of any province, at $71,000 and $52,000 respectively.
Challenges and opportunities
- Low energy and other resources prices may continue to limit growth, particularly in Alberta and Saskatchewan.
- A cooling housing market in B.C. and a levelling off of major construction projects in Manitoba will also affect growth.
- Trade uncertainty may create risk for economic growth for provinces.
- Promising new areas of growth, including clean technology and innovative agriculture and food production, can help diversify the western economy.
- Canada ranked 32nd out of 35 OECD countries in terms of its openness to Foreign Direct Investment (FDI). Canada attracted 55% less FDI in 2017 than it did in 2013.
Source: Statistics Canada, TD Economics, Conference Board of Canada, RBC Economics, OECD Analysis
Labour Market
Sustainable and Inclusive
Western Canada is home to…
- 6 million workers, which is 32% of Canada's workforce
- A regional participation rate (67%) that is higher than the national participation rate (65%)
- Over half of Canada's Indigenous employment (339,000)
Top Industries by Employment (Estimate and Share of Regional Total)
- Retail Trade (740,000) – 11.4%
- Health Care and Social Assistance (735,000) – 11.3%
- Construction (580,985) – 9.0%
- Accommodation and Food Services (504,000) – 7.8%
- Educational Services (464,000) – 7.2%
- Professional and Scientific Services (455,000) – 7.0%
- Manufacturing (391,000) – 6.0%
- Public Administration (365,000) – 5.6%
- Transportation and Warehousing (327,000) – 5.0%
- Other Services (301,000) – 4.6%
Challenges and opportunities
- The Indigenous unemployment rate (15.7%) is more than double that of non-Indigenous peoples (7.0%).
- The employment rate for women in western Canada is higher than the national average (58.4% vs 56.7%), but a significant gap remains compared to the rate for men in the west (66.3%).
- Adoption of automation, artificial intelligence, and other technologies could result in changes for occupations that currently account for over a third of employment in western Canada.
- 80% of western workers are employed full-time, while 20% are employed part-time (2017). Over the last five years, part-time positions have grown almost three times as fast as full-time employment
Did you know...
- Youth (aged 15 to 34) comprise 35% of western Canada's workforce.
- 62% of adults aged 25-64 years have completed post-secondary education.
Labour Market Snapshots

British Columbia
Employment: 2,305,690
Unemployment Rate: 6.7%
Participation Rate: 63.9% Average Income: $57,459

Alberta
Employment: 2,096,105
Unemployment Rate: 9.0%
Participation Rate: 71.8% Average Income: $73,410

Saskatchewan
Employment: 544,095
Unemployment Rate: 7.1%
Participation Rate: 68.3% Average Income: $58,420

Manitoba
Employment: 617,465
Unemployment Rate: 6.7%
Participation Rate: 66.1% Average Income: $53,219
Source: Census 2016
Want to learn more?
Annual Review of the Labour Market, 2017
Risk and Readiness: The impact of automation on provincial labour markets
Source: Statistics Canada, C.D. Howe Institute
Trade
Diversifying Products and Markets
Western Canada is home to…
- Industries that contributed to 37% of Canada's exports
- Canada's largest port, which handled 142 million tonnes of cargo valued at $200 billion in 2017
- Abundant and diverse natural resources ready to supply a growing global middle class
International trade
- In 2017, western Canada exported over $186 billion in goods (37% of national exports) and imported $113 billion of goods (20% of national imports).
- Top destinations for exports were the US (72%), China(8%), and Japan (4%).
- 41% of exports were related to oil and gas.
- Service exports in 2016 were $88 billion, or 25% of western Canada's total exports.
- Western Canada's exports grew by $42 billion (14%) from 2011 to 2016, in spite of the lower price of oil.
Did you know…
- The Port of Vancouver is the largest port in Canada and the third largest in North America.
- Western Canada produces 62% of Canada's value- added agriculture.
- A growing middle class – expected to account for 60% of the world's population by 2021 – is creating considerable demand for food, fuel resources, and goods and services.
Challenges and opportunities
- Western Canada is increasing trade with emerging economies like China and India, but there are many opportunities to grow our market-share even further.
- While global trade uncertainty has created a challenging market environment, expanding and diversifying export markets may also provide new opportunities for western Canadian goods and services.
- Western businesses can have increased opportunities to expand trade through Canada's work towards becoming an Associated State of the Pacific Alliance bloc, and through agreements such as the Comprehensive and Progressive Agreement for Trans- Pacific Partnership (CPTPP), and the Canada- European Union Comprehensive Economic and Trade Agreement (CETA).
Western Canadian Merchandise Exports by Industry and Value (2017)

Text version
Western Canada exported a total of $186 billion of goods in 2017. Oil and gas was the largest contributor to export value, making up 41% of the total.
| Western Canada | % |
|---|---|
| Agriculture | 12% |
| Oil and Gas | 41% |
| Mining | 8% |
| Food Manufacturing | 7% |
| Wood Product Manufacturing | 6% |
| Paper Manufacturing | 4% |
| Chemical Manufacturing | 6% |
| Machinery Manufacturing | 3% |
| Transportation Equipment Manufacturing | 2% |
| Other | 11% |
*projected forecast
Total export value: $186 billion
Want to learn more?
The Pacific Alliance: Why it's (Still) Important for Western Canada, Canada West Foundation
Vancouver and the opportunity of an emerging Pacific nexus, Canada West Foundation
Western Canada's Trading Relationship with China, Canada West Foundation
CETA: A progressive trade agreement for a strong middle class, ISED
The Numbers Behind the World's Closest Trade Relationship,Visual Capitalist
Source: Statistics Canada, Natural Resources Canada
Natural Resources
Abundant, Responsible, Competitive
Western Canada is home to…
- The world's largest potash reserves, third-largest uranium reserves, and third-largest crude oil reserves
- 94% of all crude oil production in Canada
- 96% of all natural gas produced in Canada
Renewable resources
- British Columbia is Canada's largest producer and exporter of lumber and other forest products.
- Nearly 89% of B.C.'s electricity and 97% of Manitoba's is produced by hydroelectric generation.
Energy & mining
- Alberta and Saskatchewan are the top producers of oil and gas in Canada.
- Saskatchewan is the world's largest producer and exporter of potash, and produces 23% of the world's uranium.
Did you know…
- Indigenous Peoples participate in a wide-range of natural resource developments, including forestry, liquefied natural gas (LNG), oil and gas, pipelines, potash, and other mining projects.
- 95% of the oil and gas exported from Canada in 2017 came from western Canada.
- In 2016, western Canada's Forestry, fishing, mining, quarrying, and oil and gas industries employed 242,000 people.
- The resource sector also has a large indirect impact. In particular, the energy sector generates a significant number of construction, services, and research jobs.
Challenges and opportunities
- Volatile commodity prices create cycles of boom and bust.
- A lack of pipeline capacity is constraining crude oil exports.
- Western Canadian businesses are investing in solutions for cleaner energy. In 2014, the oil and gas industry spent $6.5 billion on environmental protection, more than any other industry.
- U.S. duties are reducing the competitiveness of softwood lumber producers and paper manufacturers. While strong market demand and high lumber prices have helped mitigate the impact, small producers and independent manufacturers are vulnerable if demand or prices decline
The Western Share of Canadian Resource Production 100%
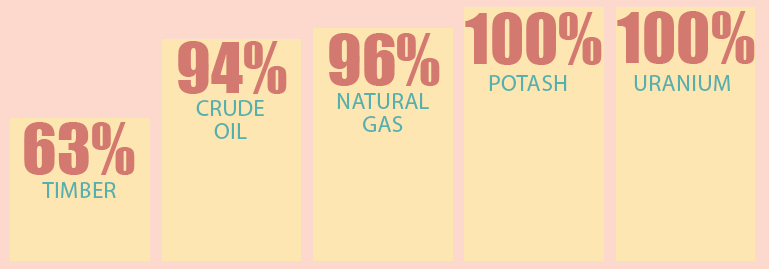
Text version
| Resource Production | (%) |
|---|---|
| Timber | 63% |
| Crude oil | 94% |
| Natural gas | 96% |
| Potash | % |
| Uranium | 100% |
Want to learn more?
Key Facts and Figures on Canada's Natural Resources
Source: Statistics Canada, TD Economics, Vancouver Economic Commission, MacLean's
SMEs and Entrepreneurship
Strengthening Our Business Culture
Western Canada is home to…
- 427,000 small-and medium-size enterprises (SMEs) employing over 3.4 million people (2015)
- 494,500 self-employed persons, who have created their own corporate entities (2017)
- Over half of Canada's Indigenous entrepreneurs
Small Businesses' Contribution to GDP (2016)

Text version
In 2016, small businesses contributed an average of 31% to provincial GDP Small businesses in Alberta and British Columbia were the highest contributors to their provincial GDP at 35% and 34% respectively. Small businesses in Saskatchewan and Manitoba generated about 31% and 28% of their respective provincial GDP.
| Geography | Contribution to GDP by small businesses |
|---|---|
| Canada | 31% |
| Manitoba | 28% |
| Saskatchewan | 31% |
| Alberta | 35% |
| British Columbia | 34% |
Top 5 SME Sectors (2017)

Text version
The illustration shows the top five small and medium enterprises (SME) sectors in Western Canada in 2017. The sector with the highest amount of SMEs was Construction with 56,330.
| Sector | Construction | Professional, scientific, technical services | Retail | Health care and social assistance | Other services |
|---|---|---|---|---|---|
| Number of enterprises | 56,330 | 52,405 | 47,535 | 38,405 | 38,275 |
Did you know…
- Western Canada has three of Canada's five tech unicorns (startups valued at more than $1 billion): Slack, Hootsuite, and Avigilon.
- Alberta has the highest number of SMEs relative to working-age population.
- MacLean's ranked 5 western Canadian universities in its "Top 20 Best Universities for Business in Canada" (2017).
- The self-employment rate in rural western Canada is nearly twice as high as in urban areas (29% versus 16%), partly due to higher farming and agricultural self-employment.
Challenges and opportunities
- Only 16% of Canadian SMEs are majority-owned by women.
- 29% of western Canada's self- employed workers are job creators with employees.
- Only 2% of Canadian SMEs are operated by Indigenous entrepreneurs.
- 12% of Canadian SMEs were exporters and 89% of exporters sold to the US (2014).
Want to learn more?
Canadian New Firms: Birth andSurvival Rates over the Period 2002–2014, May 2018
Source: Statistics Canada, TD Economics, Vancouver Economic Commission, MacLean's
Innovation
Translating Ingenuity into Growth
Western Canada is home to…
- 33,700 private sector researchers in 2015 (two-thirds from B.C.)
- Five of the top 15 Canadian research universities
- Companies selling world-leading technologies in industries such as digital services, agri-food, and clean technology
Venture Capital Investment in Western Canada (Millions of Dollars)
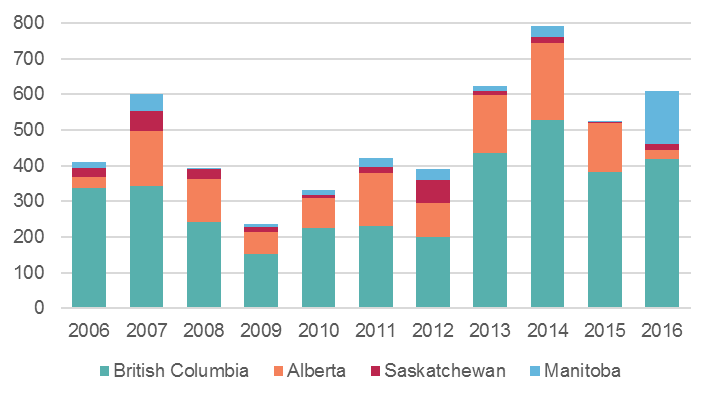
Text version
The bar graph shows the amount of capital investment in Western Canada from 2006 to 2016. Investment reached $600 million in 2007, and then dropped to a low of just over $200 million in 2009. Investments increased after that period, reaching a high of almost 800 million in 2014 and falling to $600 million in 2016. From 2006-2016, British Columbia received the most investment and Saskatchewan received the least.
| Year | Manitoba | Saskatchewan | Alberta | British Columbia |
|---|---|---|---|---|
| 2006 | $17.06 million | $27.25 million | $30.57 million | $336.81 million |
| 2007 | $47.81 million | $55.83 million | $155.57 million | $342.18 million |
| 2008 | $5.07 million | $27.17 million | $121.41 million | $241.09 million |
| 2009 | $9.61 million | $11.77 million | $63.09 million | $152.15 million |
| 2010 | $14.95 million | $7.52 million | $84.38 million | $225.12 million |
| 2011 | $24.65 million | $16.51 million | $148.93 million | $230.13 million |
| 2012 | $30.97 million | $65.6 million | $95.19 million | $199.57 million |
| 2013 | $15.18 million | $11.76 million | $161.48 million | $435.96 million |
| 2014 | $31 million | $17.34 million | $214.1 million | $528.67 million |
| 2015 | $4 million | $2.95 million | $134.92 million | $383.61 million |
| 2016 | $147.34 million | $17.4 million | $24.35 million | $420.07 million |
Access to capital
- The west attracted $609 million of venture capital (VC) in 2016, well below Ontario ($1.4 billion) and Quebec ($1.1 billion).
- Over 60% of western Canada's VC is invested in British Columbia.
- Most early-stage VC deals in western Canada are between $1-3 million.
- Innovative SMEs are far more likely to seek equity financing than other SMEs.
Challenges and opportunities
- Innovative companies often lack the investment needed to scale up.
- Companies in the west spend less on R&D than in the rest of Canada.
- Funding innovative companies creates high-quality jobs and develops new products and services.
- Half of all entrepreneurs identify funding as their main challenge.
- Canada was ranked 12th of 16 peer countries on innovation performance, and the four western provinces were graded lower than either Ontario or Quebec.
Did you know…
- There is more venture capital (VC) investment in Boston, Massachusetts than in all of Canada put together.
Research and development
- Spending on business enterprise research and development (BERD) in the west was $4.2 billion in 2015, a quarter of the Canadian total.
- The Information and Communications Technology (ICT) sector accounted for $955 million of BERD spending, two-thirds of which was in British Columbia
- Alberta's oil and gas sector accounted for $807 million of BERD spending.
R&D Spending in Western Canada (2015)

Text version
The pie chart shows the amount of spending on Research & Development in Western Canada in 2015.
| Business enterprise | Universities | Government |
|---|---|---|
| $4.2 billion | $3.6 billion | $0.5 billion |
Want to learn more?
WD: The State of Venture Capital in Western Canada
NACO 2017 Report on Angel Investing Activity in Canada
Conference Board of Canada Innovation Report Card OECD Entrepreneurship at a Glance 2017
Source: Statistics Canada, Pitchbook, Thomson-Reuters, Conference Board of Canada Innovation Report Card
Skills
Preparing For the Future
Western Canada is home to…
- 568 universities, colleges, and vocational schools
- Almost 400,000 Science, Technology, Engineering, Mathematics (STEM) graduates
- Over 82,000 engineers (Alberta has the highest concentration of engineers in the country)
University Degrees in Western Canada

Text version
The bar graph shows the number of university degrees in western Canada broken down by type of degree. The three highest number of degrees are in Business, Social Science & Law, and Health.
| Type of degree | Number |
|---|---|
| Other | 58,435 |
| Health | 283,220 |
| Engineering | 23,0175 |
| Math/Computer Science | 90,245 |
| Science & Technology | 159,330 |
| Business | 388,445 |
| Social Science & Law | 329,365 |
| Humanities | 179,245 |
| Arts & Communication | 64,035 |
| Education | 275,160 |
Education
- Western Canada's post-secondary completion rate increased from 43% in 1990 to 66% in 2016.
- Adults in western Canada without any certificate, diploma or Educational Levels of Western Canadians degree are unemployed at double the rate of post-secondary graduates.
- Full-time workers without high-school education earn a median income of $37,251, while those with bachelor degrees earn $72,760.
- There were over 160,000 registrants in apprenticeship programs (39% of Canadian total) in 2016.
Challenges and opportunities
- Employers need to attract, retain, and develop talent to respond to evolving labour market needs.
- Workers in western Canada will need to cultivate new technological and interpersonal skills to thrive in the economy of the future. Employees will require support for, and access to, workplace-based training and life-long skills development.
Want to learn more?
McKinsey Global Institute—Jobs Lost, Jobs Gained
Advisory Council on Economic Growth—Learning Nation
C.D. Howe Institute—Future Shock? The Impact of Automation on anada's Labour Market
Did you know…
- 23% of western Canadians have a bachelor's degree or above, behind Ontario (26%) but higher than Quebec (21%) and Atlantic Canada (18%).
- Albertans have the highest numeracy, literacy, and problem-solving skills in Canada. B.C. is also highly ranked in all three, while Manitoba is average, and Saskatchewan is below average.
Skills in the workplace
- On average, STEM graduates have higher median incomes than other degree-holders, but there is significant variation among individual fields.
- Alberta has the highest proportion of STEM graduates in the country.
- One in six recent graduates with a bachelor's degree is overqualified for the job that they hold.
Educational Levels of Western Canadian

Text version
The pie chart shows the education levels of western Canadians expressed as a percentage.
| No high school diploma | High school | College, trades, or university | Bachelor's degree or higher |
|---|---|---|---|
| 17% | 29% | 31% | 23% |
Source: Statistics Canada, C.D. Howe Institute, Conference Board of Canada
Ways to share your ideas
This engagement paper lays out the portrait of western Canada's economic landscape to help you make informed recommendations, so that we can succeed together. Please send us your ideas by November 16, 2018.
All comments received will be considered public. Submissions will be posted to the Western Canada Growth Strategy website within two business days in the language in which they were provided. Please read the Western Canada Growth Strategy Privacy Statement and Terms of Use.
 Online Discussion Forum
Sign up here* to submit your ideas on how we can grow the western Canadian economy.
*Users will be directed to a third-party online platform. To learn how WD will protect your privacy during this engagement, read our privacy statement.
 Group Discussion Toolkit
Communities, organizations, and industry are encouraged to organize group discussions, then report back on participant input.
Refer to the group discussion toolkit on the Western Canada Growth Strategy website to help you plan a session and shape your conversation.
Organize your own group discussion by checking out this toolkit for tips on how to plan a session, shape your conversation, and report back.

Written submissions can be submitted by email to: wd.engages-mobilisation.deo@canada.ca.

Written submissions can be sent by postal mail. As mail has a built-in delay, please mail your ideas and suggestions by November 9, 2018, to:
Western Economic Diversification Canada
C/O: Western Canada
Growth Strategy Engagement
Suite 1500, 9700 Jasper Avenue
Edmonton, Alberta T5J 4H7
Social Media

Contribute your ideas on Twitter by using the hashtag: #MyWesternCanada
Five Questions
Whether you live in rural or urban areas, are part of a small startup, or are a community leader, you have ideas about what is needed to build a strong economy. We need you to tell us what matters most to you about growing the economy, and how we can better work together to build on our existing regional strengths.
Have your say by answering the following five questions:
- What does a stronger western Canadian economy look like 10 years from now?
- What are the best ways to spur new growth in western Canada?
- What will help the Indigenous economy continue to grow?
- How can we improve economic participation in the west of under represented groups, including women, youth, and new immigrants?
- How can governments, industry, and western Canadians work together to grow the regional economy?
- Date modified: