
2020-21 Departmental Results Report
Western Economic Diversification Canada
View the print-friendly version: PDF (1.4 MB)
ISSN 2561-0996
Table of contents
- From the Ministers
- From the Deputy Minister
- Results at a glance
- Operating context
- Results: what we achieved
- Analysis of trends in spending and human resources
- Corporate Information
- Supporting information on the program inventory
- Supplementary information tables
- Federal tax expenditures
- Organizational contact information
- Appendix: definitions
- Endnotes
From the Ministers
It is our pleasure to present the 2020–21 Departmental Results Report for Western Economic Diversification Canada (WD).
In a year that was characterized by uncertainty and rapidly shifting priorities as a result of the global COVID-19 pandemic, Innovation, Science and Economic Development Canada (ISED) and its Portfolio partners remained committed in their continued efforts to meet the evolving needs of Canadians and the Canadian economy. The ISED and Portfolio Departmental Results Reports describe a number of immediate and remarkable contributions over the past year, including those that were part of Canada’s COVID-19 Economic Response Plan.
In 2020-21, WD had great success in getting services and supports to western Canadians in one of the most difficult years in the department’s 33-year history. With an increased budget to match the need for WD support in the four western provinces, WD played a large role in the government’s COVID-19 response.
With programs such as the Regional Relief and Recovery Fund, the department was able to protect the financial security of businesses through the pandemic, especially in hard-hit sectors such as tourism, hospitality and air travel. The department continued to invest in growing sectors like agri-tech, cleantech and life sciences to ensure robust vaccine development in Canada. The department continued to include rural, women-owned and Indigenous-owned businesses in its investment strategies. Building on WD’s success this last year and the recognition of a western economy that has transformed and diversified over the decades, the department has now evolved into two agencies to better reflect the diversity of western Canada, PacifiCan for British Columbia and PrairiesCan for the Prairie provinces.
Through all these initiatives and more, we continued to deliver on our commitment to foster a dynamic and growing economy that creates jobs, opportunities and a better quality of life for all Canadians, including those from diverse backgrounds, such as women, Indigenous peoples, racialized Canadians, persons with disabilities and LGBTQ+ groups.
We invite you to read this report to learn more about how WD, like ISED and other Portfolio partners, are building a strong culture of innovation to position Canada as a leader in the global economy.

The Honourable
Daniel Vandal
Minister of Northern Affairs, Minister responsible for Prairies Economic Development Canada and Minister responsible for the Canadian Northern Economic Development Agency

The Honourable Harjit S. Sajjan
Minister of International Development and Minister responsible for the Pacific Economic Development Agency of Canada
From the President
This was a humbling year. I watched as businesses ran at a loss because their owners just wanted to look after their staff and clients. I watched as non-profits completely re-invented themselves to meet different needs. I watched as our WD team and our partner organizations worked past exhaustion to deliver five times more funding than in a typical year.
Times were already tough in many parts of western Canada before COVID hit. They say that crisis brings out the best and the worst in people. This year I have seen very little but the best.
This report captures a piece of the WD role. Yet, it has been a whole community effort to take us through this emergency in ways that preserve good jobs and position us to recover quickly.
Humbling indeed.

Dylan Jones
President of the Pacific Economic Development Agency of Canada and Interim President of Prairies Economic Development Canada
Results at a glance
This was an extraordinary year as WD worked hard to deliver on its core economic development mandate, while at the same time helping western Canadians navigate challenging economic circumstances caused by the COVID-19 pandemic.
- In 2020-21, WD employed 386 talented FTEs, compared to 327 planned FTEs.
- The department’s actual spending rose to $907.5M, compared to planned spending of $274.8M.
- WD’s budget nearly tripled compared to 2019-20. Furthermore, WD saw 15 times more project approvals in 2020-21 (4,692) compared to 2019-20 (312). Similarly, compared to WD’s 5 year average number of project approvals (440), 2020-21 saw over 10 times more project approvals. These increases demonstrate the strong demand for WD’s support.
WD, along with the other regional development agencies across the country, played a key role in the Government of Canada’s COVID-19 relief programming. Following an overwhelming demand for government support, the department helped small and medium-sized enterprises (SMEs) throughout western Canada stay in business. WD helped western Canada through a time of need. A few accomplishments of which we are particularly proud include:
- Supporting SMEs that may not have otherwise been able to access other federal government funding, including rural, women-owned and Indigenous-owned businesses.
- Providing much needed support to western Canadian businesses impacted by the pandemic. Project approvals surpassed 4,500 with WD funding totalling $390M.
- Helping maintain, create or expand over 16,000 western Canadian businesses.
In addition to supporting western businesses through the pandemic, WD continued to deliver on its core mandate of promoting economic diversification throughout western Canada. WD’s economic development projects reported the following economic impacts:
- Creation of over 7,000 jobs for western Canadians.
- $348M in export sales growth.
- $372M in business sales growth from commercialization of new or existing technologies.
- Building an inclusive economy, with targeted programming helping women, youth, Indigenous Peoples, persons with disabilities, rural SMEs and communities, and francophones.
For more information on WD’s plans, priorities and results achieved, see the "Results: what we achieved" section of this report.
Operating context
In March 2020, the world stood still. As COVID-19 spread, countries and regions, including western Canada, started to shutdown seemingly overnight. By the end of March, each western province had declared states of emergency, forcing businesses to close, some with no clear picture of when they could re-open. This caused a spike in layoffs, as companies could not shoulder even temporary closures and still pay their employees. The movement of people was reduced to a minimum in order to prevent the spread of the virus. People were forced to stay at home because of job losses, business closures, and work from home orders. In the blink of an eye, established routines were gone.
No western province was left unscathed in 2020, regardless of their position prior to the pandemic. Manitoba (-4.8%) and British Columbia’s (-3.8%) economic declines were somewhat milder because of the relative size of their service sectors, compared to their goods sectors. The provinces of Alberta (-8.2%) and Saskatchewan (-5.2%), had the largest declines in the west. Alberta’s decline was also the largest among all provinces in 2020. The oil price crash in late 2018, coming in the wake of the 2015-16 downturn, left the economies of Saskatchewan and Alberta in a significantly weakened state just prior to the start of the pandemic. As countries began shutting down, oil prices collapsed, and the West Texas Intermediate (WTI) price fell to a negative level in April 2020. Capital expenditures had already declined in Alberta (-4.6%) and Saskatchewan (-4.5%) in 2019, and both fell by 16.3% in 2020. Manitoba’s investment fell by 18% in 2020, but British Columbia managed a subdued 2.4% increase in capital expenditures.
As countries shutdown and economic activities halted, trade also slowed. Domestic exports were 8.1% lower in March 2020 compared to the same month the previous year. Most of this decline was from a fall in exports in Alberta and British Columbia. By May 2020, western exports had fallen nearly 39% compared to a year earlier. Trade gradually recovered but remained weak throughout 2020, declining by 14% compared to 2019. Not all western provinces experienced the same declines in exports. With the world on pause, oil demand cratered and Alberta’s exports declined by 22% in 2020. However, with increased demand for agri-food products and its status as a secure producer, Saskatchewan’s exports increased by 2.2%, one of only two Canadian provinces to increase.
The provincial lockdowns to reduce the spread of the virus caused businesses to close. From February 2020 to April 2020, the number of business closures in the west more than doubled to nearly 36 thousand, but by the summer, with support measures in place, closures fell below normal levels. However, subsequent lockdowns to address new waves of the virus caused small bumps in closures. After falling in the spring of 2020, the number of active businesses in western Canada slowly crept up, but had not returned to pre-pandemic levels by early 2021. So far government support has been able to stave off mass business failures, but with the pandemic ongoing the full extent of the impact on businesses in western Canada is unknown.
Similarly, unemployment in the west more than doubled to nearly 870 thousand by May 2020. As of March 2021, the number of unemployed was still 30% higher than in February 2020. By the end of 2020, the number of people receiving Employment Insurance in the West reached historic levels. While nearly 15% of western employment was wiped out between February and April 2020, some groups were hit significantly harder. Almost 18% of Indigenous employment in the west disappeared over those two months, while just over 17% of female employment was erased. Western youth were particularly hard-hit by the pandemic closures, losing over 35% of their employment between February and April. By March 2021, youth and female employment was still approximately 1% below the level in February 2020, as was all western employment. Indigenous employment has managed to increase by almost 4% since February 2020.
A surprising development of the pandemic was the surge in activity in residential housing markets across Canada. In the west, value of sales in residential markets increased nearly 27% in 2020, compared to falling dollar volumes since 2017. Not all western provinces experienced the same magnitude of increases. British Columbia experienced a 35% increase in value of sales, the highest among the provinces in Canada. The acceleration of real estate activity in British Columbia was large enough to counteract some of the economic decline in the province. Saskatchewan also saw large increases in dollar volumes (+28%). The increases in Manitoba (+19%) and Alberta (+5.1%) were more modest. At the beginning of 2021, the value of sales accelerated even further.
Over 12 months, and three COVID-19 waves, the pandemic still had the west in its grasp in March 2021. As with the rest of the world, the four western provinces were forced to grapple with a historic challenge. As the virus moved through the populations, the provinces were forced to adapt their strategies as new cases climbed and information evolved. As western Canada creeps back towards "fully open", the question on what "normal" means in the future remains.
Regional Relief and Recovery Fund (RRRF)
The Regional Relief and Recovery Fund (RRRF) was created to help businesses that were negatively impacted by the COVID-19 pandemic and were unable to access other federal pandemic support programs, or that continued to have liquidity needs1. From the program launch to March 31, 2021, WD has consistently seen much higher volumes of applications than any other regional development agency (RDA), receiving nearly as many requests as the other five RDAs combined. Alberta businesses alone requested more funding than the combined requests from the four Maritime provinces, all three territories, and Quebec.
As of the end of March 2021, WD, along with its 89 Community Futures and 4 Women’s Enterprise Initiative (WEI) offices, has:
- Been allocated more than $850 million of the over $2.1 billion in available RRRF funds at the disposal of RDAs.
- Received nearly 17,000 applications requesting more than $1.6 billion in support.
- Assisted over 8,800 SMEs by providing nearly $560 million in conditionally repayable, repayable, and non-repayable contributions
Project Spotlight:
The Tin Wis Resort
The Tin Wis Resort is an 85-room beachfront hotel in Tofino, BC that is owned by the Tla-o-qui-aht First Nation (klay-o-kwee-at) and provides a source of revenue and employment for its members. Like many tourism-reliant businesses, the resort has experienced a decline in revenue because of COVID-related travel restrictions. Tin Wis used RRRF funding to maintain 35 jobs – including those for women, Indigenous and youth employees – and pay operating costs to support this important community asset.
Project Spotlight:
MoveMobility
MoveMobility is a Manitoba company that modifies vehicles to make them more accessible for people with mobility challenges. Their customers include First Nations, assisted living facilities, and medical service providers. WD’s $500,000 RRRF investment helped the company to maintain 26 highly skilled jobs and operations during the COVID-19 pandemic.
Project Spotlight: RRRF and BSP
AltaML
AltaML is an Alberta-based developer of artificial intelligence (AI) software. An innovative company with operations in Edmonton and Calgary providing services and solutions to assist clients to leverage the strength of artificial intelligence and machine learning to business data. AltaML works with organizations to gain competitive advantages such as increased profit, efficiencies or reducing greenhouse gases. AltaML received $1M in repayable BSP funding, and $970K in repayable RRRF funding. With over 120 talented team members, AltaML is the largest AI employer in Alberta. AltaML started with 4 team members and has doubled its workforce every year. As a result of WD funding, the company created 42 new HQP jobs and increased revenues from $2.5M to $5.4M. The future looks bright for this innovative company.
There were a multitude of lessons learned in the creation and delivery of the RRRF, as the program was developed and launched in a very short period of time (weeks rather than the usual months), and continued to evolve to align with other federal pandemic relief programs. A key lesson learned was the need to streamline processes in order to handle the unprecedented volume of applications that WD received.
Assessment, approval, and payment procedures were simplified in order to deliver funding quickly to companies that were negatively impacted by the pandemic. This resulted in providing clients easier access to funding and reducing administrative burden during a time of duress. WD adjusted its program parameters and policies in response to changing requirements in the economy and other pandemic relief programming. This assisted in both a broadly consistent delivery between regions and RDAs as well as a solid set of reference materials for new staff training and onboarding.
The RRRF program delivery team collected GBA+ related data (equity seeking groups) for several indicators. As of March 31, 2021, the program had assisted:
- 2,699 women-owned or operated businesses ($124.6 million);
- 309 Indigenous businesses ($18.1 million); and
- 4,174 rural businesses ($258.1 million).
Under-represented groups received a greater portion of the RRRF funds than their representation in the market:
- Rural: RRRF approvals represented more than three times the percentage of rural SMEs in the business population;
- Women-owned: RRRF approvals represented more than double the percentage of women-owned SMEs in the business population; and
- Indigenous-owned: RRRF approvals represented over twice the percentage of Indigenous-owned SMEs in the business population.
Results: what we achieved
Core responsibility: Economic development in western Canada
Description:
Western Economic Diversification Canada (WD) promotes growth and diversification in the western Canadian economy by enhancing innovation, improving business competitiveness, promoting the adoption of clean technologies and inclusive growth.
Results
Based on WD’s core responsibility, the department works towards achieving its mandate through fulfilment of the following three departmental results:
- Businesses are innovative and growing in western Canada.
- Communities are economically diversified in western Canada.
- Businesses invest in the development and commercialization of innovative technologies in western Canada.
An initiative that overarches all three departmental results is the Western Canada Growth Strategy (WCGS). The WCGS (also known as Grow West) was established in 2019 to explore ideas, build partnerships, convene, network, build knowledge and give a voice to western Canada’s economic needs and opportunities. With a focus on four key pillars of growth – diversification, trade, skills, and communities – Grow West is co-led by 9 federal departments to pursue shared outcomes and leverage a wide range of federal programs and initiatives that support growth, diversification and well-being for western Canadians.
In a year like no other, the western economy has faced significant challenges and impacts. Just as our economy and all of the businesses and institutions within it have had to adapt, Grow West has been adapting in step, with an unrelenting drive to position western Canada for rapid recovery, and long-term, sustainable, and inclusive growth in traditional and emerging sectors. Through strengthening relationships and expanded networks, strategic advocacy and project co-development, the Western Canada Growth Strategy has achieved the following results in 2020-21:
- Facilitated cross-government and external stakeholder stocktaking and priority-setting exercises at the onset of the pandemic with periodic updates to monitor progress and course correct the strategic direction and approach of WD.
- Provided integral pathfinding, advocacy and convening services to ensure that western Canada is well positioned to engage in and benefit from transformational recovery and long-term growth opportunities.
- Supported western businesses and partners in accessing a range of federal supports and strategic programming that directly corresponds to western Canadian economic priorities, such as:
- The Regional Relief and Recovery Fund;
- The Strategic Innovation Fund (SIF), and SIF – Net Zero Accelerator Initiative; and,
- The Universal Broadband Fund.
- Continued growing a valuable, regionally specific knowledge base that partners and stakeholders will be able to draw upon as they engage in activities to grow and diversify the western Canadian economy.
- Developed a forward-looking advocacy and engagement plan to work with federal partners to promote growth that builds on western Canada’s strengths in areas such as natural resource development and agri-food, while recognizing and advancing its emerging opportunities in areas such as clean technologies and hybrid electric vehicles (HEVs), among others.
WD also promotes inclusive growth in western Canada by fostering a dynamic and growing economy that creates jobs, opportunities and a better quality of life for all Canadians, including those from diverse backgrounds.
Results:
Gender-based analysis plus (GBA+)
WDs inclusiveness priorities for all programs focus on women, Indigenous Peoples and youth. WD also collects data on project impacts on the Francophone community, and monitors the percentage of western Canadian SMEs owned by women, Indigenous people, visible minorities and youth, and evaluates program impacts on equity and economic participation for diverse groups of people. WD is currently reviewing diversity and inclusion training recommendations with a view to incorporate GBA+ specific training as part of a learning pathway document for all employees.
Also, within the larger GBA+ context, and after identifying knowledge gaps in the available entrepreneurship data, WD commissioned the Centre for Innovation Studies to launch GEM studies across the West with additional questions and a larger sample to better understand the unique challenges faced by women and youth. Released in 2020, the GEM reports on the entrepreneurial activity of women and youth in western Canada offered valuable insight across the four western provinces. The first round of GEM studies have had an impact in a number of ways:
- WD’s investment has already sparked new research and partnerships across Canada.
- The published reports and launch event have passed along the results and learnings with ecosystem partners. More broadly, the insights gained from the reports were shared with other federal departments and through a social-media campaign.
- By filling knowledge gaps, WD continues to improve thinking within the entrepreneurial ecosystem and better target supports for women and youth entrepreneurs.
Experimentation
Experimentation is a key part of WD’s fabric. The onset of the COVID-19 pandemic highlighted how nimbly WD was able to pivot to provide tablets/laptops for staff, establish remote access, and provide collaboration tools such as MS teams. Although WD had experience in the work-from-home context prior to the pandemic, it now increased access to the suite of Microsoft 365 tools for easier, faster, and more streamlined communication and work processes.
This past year, the Western Canada Business Service Network (WCBSN) played an instrumental role in responding quickly to the changing needs of entrepreneurs to help them navigate the adverse effects of the COVID-19 pandemic. With additional funds under the RRRF, the WCBSN shifted and expanded their service delivery model to a virtual environment, produced new e-commerce content and digitized additional business information for online, round-the-clock access. For example, the Business Link of Alberta’s website traffic increased over 1,600% in April 2020 compared to the prior period and their COVID-19 webpage had over 10,000 views.
An experimentation mind-set was at the forefront of the longitudinal study contracted by WD (finalized in 2021 by independent external experts) to analyze longer-term economic performance data of select for-profit and not-for-profit clients. The longitudinal study found, for example, that WD’s Western Innovation Initiative (WINN) projects – a zero interest loan program to for profit businesses - supported strong economic revenue increases for its clients.
The incremental revenues resulting from sample WINN projects accelerated over the six-year time period from $5.7 million in 2014 to $165.1 million in 2019. Long-term employment created by sample WINN clients increased steadily from 124.5 FTEs in 2014 to 854.1 FTEs in 2019, mostly in the highly qualified personnel category. Total public and private investment raised by sample WINN clients was estimated to be $1.46 billion equating to a leverage of $271.41 for every dollar in WD funding. Other outcomes of the study included lessons learned and best practices to refine program parameters and examine default rates of for-profit clients.
2030 Agenda for Sustainable Development
WD’s sustainable development vision is for an inclusive western Canadian economy that is growing, diversified and sustainable. This includes sustainable development programming that focuses on projects that create economic benefits for western Canada. Areas of investment include clean technology and clean resources, helping communities transition their economies away from coal-fired electricity generation, and fostering practices that promote sustainable development in the department’s internal operations. Through WD’s inclusiveness priority, the department is also committed to increasing the economic participation of Indigenous people, women, and youth. Together, these activities advance the following Sustainable Development Goals:
- Goal 8 (Decent Work and Economic Growth, targets 8.2 and 8.3);
- Goal 9 (Industry, Innovation and Infrastructure, target 9.4); and
- Goal12 (Responsible Consumption and Production, targets 12.2 and 12.7).
WD also supports the core 2030 Agenda principle of "leaving no one behind" by providing services and financial support to businesses and not-for-profit organizations that aim to increase the economic participation of underrepresented groups in the West. Moreover, WD ensures that all its policies and programs are informed by how they can advance inclusive participation.
Departmental Result: Businesses are innovative and growing in western Canada
WD tracks the following four performance indicators to capture the impact of this departmental result:
| Performance indicators | Target | Date to achieve target | 2018–19 Actual results | 2019–20 Actual results | 2020–21 Actual results |
|---|---|---|---|---|---|
| Value of exports of goods from western Canada ($) | $214.0B | March 31, 2021 | $207.7B | $209.5B | $179.7B |
| Value of exports of clean technologies from western Canada ($) | TBD2 | March 31, 2021 | n/a | $3.5B | $3.5B |
| Revenue growth rate of firms supported by WD programs3 | 10% | March 31, 2021 | 12.3% | 6.4% | 20.3% |
| Number of high-growth firms in western Canada | 3,550 | March 31, 2021 | 3,680 | 3,440 | 3,780 |
The first indicator, related to the value of exports of goods from western Canada, missed its target of $214.0 billion dollars, with actual results totalling $179.7 billion dollars. This variance is due to a combination of the economic slowdown related to COVID-19 and lower commodity prices.
Western Canada accounts for approximately 37% of Canada’s international merchandise exports, but less than a third of Canada’s population. As a consequence, the West is more exposed to trade disruptions, with exporting sectors facing a high level of exposure to trade and supply chain disruptions. COVID-19 has been one of the largest systemic disruptions impacting global trade and supply chains on record. The impact from the pandemic (lockdowns, border closures, curtailed global production, global demand destruction, etc.) single-handedly contributed to the estimated 6.0% decline in real GDP in Western Canada in 2020, including the 14% decline in Western merchandise exports (compared to the national decline of 12.2%).
Secondly, falling commodity prices had a significant impact on the decline in mining, quarrying, and oil and gas exports. For example, on an annual basis, the Western Canadian Select crude oil price fell 36% in 2020. The 14.2% decline in western Canada exports to $179.7 billion in 2020 was driven primarily by Alberta and, to a lesser extent, B.C. These were the only two of the four western provinces to see a decline in exports in 2020. In Alberta, the decline was driven by dramatic decreases in natural resources extraction and wholesale trade. In B.C. the decline in exports was led by the sectors of mining, oil and gas extraction and wholesale trade.
Through the Businesses departmental result, WD provides support to businesses directly, or indirectly. WD’s flagship program targeting businesses directly is the Business Scale-up and Productivity (BSP) program, where the department offers funding to support high-growth businesses that are scaling up and producing innovative goods, services or technologies. It offers interest free repayable funding to incorporated businesses.
In 2020-21, WD supported 106 businesses through BSP, and projects reported the following results:
- 859 jobs created.
- Revenue growth of $656M over last year.
- Incremental exports of $183M due to WD’s investment.
Project Spotlight 1: BSP
Circle Cardiovascular Imaging Inc.
Cardiovascular Imaging Inc. (Circle) is a software company that develops cardiovascular magnetic resonance (CMR) products used across the world to diagnose patients. CMR is the most effective means of diagnosing cardiovascular diseases. Established in 2007, Circle is a global leader in its field. Circle is based in Calgary and has international subsidiaries. Circle is expanding and developing new products with support totalling $2.5M from WD through the BSP. In 2020, Circle achieved revenues of $23.3M, and created 20 new HQP jobs. The Calgary-based health technology company is helping improve quality of life for Canadians and people around the globe.
Project Spotlight 2: BSP
Dot Technology Corp.
Saskatchewan’s Dot Technology Corp. developed a power platform for autonomous farming to help save money and time while also reducing on-farm accidents. Since receiving WD’s BSP support of $5M in funding, it has attracted investments totalling $10.9M, including an acquisition by Raven Industries, Inc., a technology company with headquarters in the US. In July 2021, Case New Holland acquired 100% of the capital stock of Raven Industries, furthering a partnership with a global leader in agricultural equipment. These acquisitions have resulted in significant supply chain efficiencies, as well as greater access to the US market. With COVID-19 providing headwinds, sales have doubled each year since 2017, reaching over $1M for the first time in 2020.
WD also supports western Canadian businesses indirectly through third party organizations because they can help the department reach a larger quantity and variety of western Canadian businesses. One key program to accomplish this is the Regional Innovation Ecosystems (RIE) stream. Funding offered under this stream helps create, grow and nurture inclusive regional ecosystems that support business needs and foster an entrepreneurial environment conducive to innovation, growth and competitiveness. It also increases the competitiveness of small- and medium-sized enterprises (SMEs), women entrepreneurs and underrepresented groups. In 2020-21, WD approved $62.5M in multi-year assistance for 41 innovation projects aiming to create, grow and nurture inclusive innovation ecosystems. Key RIE results included:
- $33.2M in business expenditures in research and development.
- 4,150 jobs created.
- $170.3M in revenue growth generated.
Project Spotlight: RIE
Victoria Innovation + Advanced Technology & Entrepreneurship Council (VIATEC) + Accelerate Okanagan (BC)
WD invested $2.9 million to implement a scale-up project in Southern Vancouver Island and the Okanagan region of BC. Its objective was to help train company executives, increase employment in the technology sector, encourage career-long learning, and enhance the abilities of companies to attract and retain talent from other global regions. The Greater Victoria technology sector currently generates over $4 billion in annual revenues while the Okanagan tech sector generates $1.67 billion annually. It is anticipated that this project will help increase revenues for Greater Victoria to $10 billion by 2030 and to $4 billion for the Okanagan by that year. Other expected outcomes of the project include the creation of 450 new jobs, $60M in revenue growth for technology sector companies, $36M in export sales growth, $12M in business expenditures on research and development, and assistance to 240 businesses. This project supports the digital technology cluster and strengthens the business ecosystem through capacity-building activities.
WD also uses the Community Economic Development and Diversification (CEDD) stream to support economic development initiatives that contribute to the growth and diversification of communities and non-innovation related ecosystems across Western Canada.
Departmental Result: Communities are economically diversified in western Canada
WD tracks the following two indicators to capture the impact of this departmental result:
| Performance indicators | Target | Date to achieve target | 2018–19 Actual results | 2019–20 Actual results | 2020–21 Actual results |
|---|---|---|---|---|---|
| Percentage of SMEs that are majority-owned by women, Indigenous people, youth, visible minorities and persons with disabilities in western Canada4 | Women: 15.8% Indigenous: 2.3% Visible minorities: 16.1% Youth: 16.6% Persons with disabilities: 0.3% |
March 31, 2021 | Women: 15.1% Indigenous: 2.2% Visible minorities: 15.1% Youth: 15.7% Persons with disabilities: 0.4% |
Women: 15.1% Indigenous: 2.2% Visible minorities: 15.1% Youth: 15.7% Persons with disabilities: 0.4% |
Women: 15.1% Indigenous: 2.2% Visible minorities: 15.1% Youth: 15.7% Persons with disabilities: 0.4% |
| Amount leveraged per dollar by WD in community projects | 1.0 | March 31, 2021 | 1.15 | 1.16 | 1.087 |
WD missed the target in relation to four of the five sub-groups for majority ownership by under-represented groups. The share of majority-owned women SMEs fell short of WD’s target. According to the Global Entrepreneurship Monitor’s 2018 Canada Report, the rate of early-stage activity by women is increasing, however this activity has not translated into an increase in the number of established businesses as expected.
The share of majority-owned visible minorities SMEs missed its target, as did the share of majority-owned youth SMEs. Recent economic uncertainty could be a factor in the declining share of new youth-owned businesses. In the 2019 Global Entrepreneurship Monitor’s Report on Youth Entrepreneurship, youth’s perception of entrepreneurship opportunities has decreased since 2013. Going forward, the department will explore new programming options to continue supporting underrepresented groups in western Canada.
One of WD’s primary delivery mechanisms under this departmental result is the Western Canada Business Service Network (WCBSN). The WCBSN is a network of more than 100 independent organizations – representing the Community Futures (CF), the Women’s Enterprise Initiative (WEI), the Francophone Economic Development Organizations (FEDO), the Small Business Services (SBS), Indigenous Business Development Services (IBDS) and Entrepreneurs with Disabilities Program (EDP) – that receive WD funds to help western Canadians start, grow and expand their businesses.
The WCBSN assisted their clients to pivot their operations, find new sales channels, and strengthen their business skills to help maintain businesses and jobs. In 2020-21, the WCBSN provided 164,857 business information and advisory services to their clients. They also experimented with new and enhanced virtual service delivery models, extending their reach to a greater number of clients and communities.
WD’s WCBSN assisted 9,378 businesses in starting or expanding their operations, and served more than 44,000 clients by providing targeted business support services to rural entrepreneurs, Indigenous peoples, women, youth, persons with disabilities and members of the Official Languages Minority Communities (OLMC). CF and WEI experienced significant demands on their resources by delivering RRRF (see project highlight) in addition to their regular core programming. Core activities included the delivery of 896 CF loans valued at nearly $44 million to rural SMEs and 72 WEI loans valued at over $6.2 million to women-owned SMEs. These loans created or maintained a combined total of over 2,830 jobs across western Canada.
An analysis of data from CFs regarding its loan clients, compared to similarly sized and located companies contained in Statistics Canada’s database, demonstrated continued superior results by CF clients as follows:
- In terms of employment growth from 2013 to 2018, CF-assisted firms collectively increased their number of employees by 7.52 percent compounded annually compared to 0.57 percent in non-assisted firms.
- In terms of sales growth from 2013 to 2018, CF-assisted firms exhibited 8.69 percent compounded annual sales growth rate compared to 3.29 percent for non-assisted firms. In addition, CF loan clients were able to withstand initial shocks due to economic activity better than firms without CF assistance. Sales growth of CF-assisted firms also tended to outperform sales growth of comparable firms during periods of economic slowdown.
- CF-assisted firms exhibited significantly stronger longevity at 59 percent for a 5-year survival rate than non-assisted firms at 46 percent.
In 2020-21, WD provided $5M in additional funding under the Women Entrepreneurship Strategy (WES) to assist western ecosystem recipients to provide enhanced business support services to women entrepreneurs adversely impacted by the COVID-19 pandemic and the ’she-cession’. This included new digital and social media training, and marketing and financial advisory services to strengthen their resiliency. In total, the recipients provided specialized business advisory services to over 11,015 women entrepreneurs to help them navigate through the pandemic.
WD also introduced a new, more inclusive method to deliver the Economic Development Initiative (EDI) to support Francophone economic development. The FEDOs, members of the OLMC in Western Canada, are now delivering the 3-year, $1.8 million pilot Pan-West Francophone Economic Development Fund (FDEFO), ensuring greater community decision-making into local projects. In its first year and amidst the pandemic, the FEDOs approved 17 community projects worth $463,500 to support Francophone youth, enhance tourism infrastructure and expand access to cultural events through livestreaming.
Project Spotlight: RRRF and WEI
Regional Relief and Recovery Fund (RRRF)
The CF and WEI helped an unprecedented number of businesses stay afloat during the pandemic by delivering RRRF emergency relief loans to rural and women entrepreneurs. In addition to their core programming, CF approved $181.8 million in RRRF loans for 3,800 rural SMEs, which created or maintained over 14,600 jobs. WEI approved $11.3 million in RRRF loans for 335 women-owned SMEs, with over 1,300 jobs created or maintained. This is nearly three times the number of loans provided by the CFs and WEIs in a typical, non-pandemic year, representing a significant increase in activity to meet the surge in demand across western Canada. Loan approvals by CF and WEI for underrepresented groups include SMEs owned by women ($69.9 million), Indigenous peoples ($10.1 million), youth ($6.8 million), persons with disabilities ($5.7 million), and Francophones ($3.8 million). Demonstrating impressive agility and responsiveness, the provincial CF associations pivoted and successfully managed RRRF loan funds, prepared CF offices, developed application and reporting tools, and worked collaboratively to distribute funds to the areas with highest need.
Project Spotlight: RRRF (CF)
Alberta iMarket
Alberta iMarket - is an online bilingual marketplace that sells regional and rural goods and services in Northern Alberta. Developed in partnership by the CF offices of Lac La Biche, Lakeland, Lloydminster and St. Paul – Smoky Lake Region, along with the Conseil de développement économique de l’Alberta (CDEA), the Alberta iMarket was created to shop local, promote Alberta-made products, stores, and entrepreneurs, and offer rural entrepreneurs a cost-effective solution to pivot to e-commerce. Funded by WD’s RRRF and the Rural Opportunities Fund, the CFs invested $158,000 in Alberta iMarket to help rural businesses and entrepreneurs list their local fare or services, and sell directly to customers online. Pivoting to online shopping counteracted the adverse effects of the COVID-19 pandemic on rural businesses and communities by keeping rural jobs and businesses afloat at a time when public health protocols required retail businesses to shut down in-person shopping. To date, the Alberta iMarket showcases 2,764 local products in 13 categories by 129 vendors.
Project Spotlight:
Business growth amidst COVID-19
Colouring it Forward is an Indigenous enterprise that promotes healing and reconciliation between Indigenous and non-Indigenous people through colouring books, journals and workshops. The books share positive teachings from the elders, artwork from Indigenous artists, and space for journaling. Diana Frost, an Algonquin Metis from Quebec and founder of Colouring it Forward, turned to WD’s WCBSN partners in Alberta: IBDS, FEDO, WEI and SBS for solutions and financing after the COVID-19 pandemic restricted in-store shopping and book sales plummeted. To save and grow her business, Diana successfully pivoted her operations to online shopping, digital product offerings, business to consumer sales and social media marketing. Colouring it Forward has now partnered with other Indigenous artists to add colouring books on the Cree, Blackfoot, Dene and Ojibway Nations in English and French. Diana has grown her business to reach over 180 stores and displays Indigenous art in large museums and galleries.
Departmental Result: Businesses invest in the development and commercialization of innovative technologies in western Canada
WD tracks the following three indicators to capture the impact of this departmental result:
| Performance indicators | Target | Date to achieve target | 2018–19 Actual results | 2019–20 Actual results | 2020–21 Actual results |
|---|---|---|---|---|---|
| Value of business expenditures in research and development by firms receiving WD program funding ($) | $35.7M | March 31, 2021 | $21.3M | $15.8M | $50.5M |
| Percentage of professional jobs (including science and technology S&T) in western Canada | 33.5% | March 31, 2021 | 32.4% | 32.8% | 35.0% |
| Percentage of companies engaged in collaborations with higher education institutions in western Canada8 | 9% | March 31, 2021 | 8.8% | 8.8% | 10.2% |
The variance for the indicator, value of BERD, is attributed to several multi-year projects for which results were realized or reported earlier than anticipated. Analysis into the second indicator, relating to the percentage of professional jobs in western Canada, was sourced from Statistics Canada’s 2020 Labour Force Survey. It saw Science and Technology (S&T) jobs totalling 2,026,700 in western Canada. This compared to total employment of 5,795,900, for a total percentage of 35.0%. In terms of long term trend and to put this into perspective, S&T jobs have increased by 268,600 since 2015.
The COVID-19 pandemic disproportionately impacted occupations outside the professional, scientific and technical (PST) occupations. A deeper dive into this indicator reveals that in western Canada, PST employment actually rose 0.5% (+10,000) in 2020 while total employment in the four western provinces fell 6.1% (-376,200). Non-PST occupations carried the burden of pandemic job losses as employment fell 9.3% (-386,200). As a result of these disparate experiences in 2020, PST’s share of employment rose to the highest level on record, increasing 2.3 percentage points from 2019 to 35.0%. As the economy rebounds, though, job gains are likely to be experienced to a greater extent in non-PST occupations and the PST share should retreat in 2021.
WD promotes innovation in western Canada. Consequently, WD supports the development and commercialization of innovative technologies in many ways. The first is the Business Scale-up and Productivity (BSP) Program, which aims to accelerate the growth of firms and assist with the adoption and adaptation of new, innovative technologies that support scale up, productivity, development of new markets, and entry into new markets to help companies become globally competitive.
The second way in which WD supports commercialization is the Western Innovation Initiative (WINN). The WINN was a five-year (2013-2018) federal initiative that offered repayable contributions for small and medium-sized enterprises (SMEs) with operations in Western Canada, in order to help move their new and innovative technologies from the later stages of research and development to the marketplace. Many projects were multi-year in nature and are still active. There are 116 projects that are still active under this initiative.
WD’s investments have enabled the following results to be achieved under the WINN in 2020-21:
- 77% of all jobs created were highly qualified personnel.
- Over $158.2M revenue growth.
- $115.2M sales growth resulting from commercialization.
- 28% revenue growth between 2017 and 2018.
Project Spotlight:
WINN Tasktop Technologies Inc.
Tasktop, a Vancouver-based company, received WD support of $727,100 under the WINN to enhance and commercialize a software that helps companies visualize the development process to develop their own software more expediently. Since 2007, Tasktop has grown from 5 employees to an international organization with over 80 employees. Fast forward to 2021 and Tasktop continues to grow with a headcount of about 200 workers. In addition to adding more jobs which are mostly based in southern BC, Tasktop revealed the close of a US$100-million ($126 million) funding round led by Sumeru Equity Partners with participation from previous investors. This investment means Tasktop will have the opportunity to provide even more market-leading and customer-centric innovation.
Project Spotlight:
Vaccine and Infectious Disease Organization
The Vaccine and Infectious Disease Organization (VIDO) is a world leader in developing vaccines and technologies against infectious diseases. Budget 2021 proposed $59.2M over 3 years, starting in 2021-22, for the Vaccine and Infectious Disease Organization (VIDO) to support the development of its vaccine candidates and expand its facility in Saskatoon. Bio-manufacturing and life sciences is a growing sector that supports thousands of good, middle class jobs. In 2020, WD invested $35M in VIDO, including $12M to expand its bio-manufacturing capacity to support clinical trials and $23M to accelerate the development of a vaccine against COVID-19.
Project Spotlight: RIE
Orthopaedic Innovation Centre
Government and industry are collaborating to ensure the health and safety of Canadians through the COVID-19 pandemic. One example is the transformational work of Winnipeg’s Orthopaedic Innovation Centre (OIC). The OIC started in 2010 as a partnership between the Concordia Joint Replacement Group, the Concordia Foundation, the Province of Manitoba and WD. OIC applied to WD to fund its new PPE product-testing division, and WD invested approximately $200,000 in 2020. OIC was therefore able to provide crucial testing to Precision ADM and other western Canadian PPE manufacturers, which could then commercialize and produce a high volume of products here in Canada, for the Canadian market. Martin Petrak, President and CEO of OIC, stated at the time, "I think it’s important for people to understand how important WD and other partners were to the growth of the OIC. We were able to, through the establishment of other companies and other organizations, generate 150 jobs, create millions of dollars of research and development, and then millions of dollars of commercial value in Manitoba and Western Canada."
Project Spotlight: WES
NSD Tech
NSD tech is an IT firm specializing in website and application solutions – design, coding and branding - and provides its tech products in over 10 languages. In 2019-20, WD provided NSD tech with a $100,000 investment through the Women Entrepreneurship Strategy (WES) toward equipment, wages and professional services. WD funding supported the development of their proprietary client relationship management software, CARMIS, which is targeted to non-profit agencies serving refugees and immigrants across Canada, and is designed to simplify their process in meeting federal reporting requirements and improve overall data flow within the agencies. This project led to the creation of 3 HQP jobs and over $200,000 in revenue growth for NSD. Sumegha Gupta, President and CEO of NSD, credits her family, as well as non-profit and government support for helping her navigate to where she is today. WD’s WES funding was, according to Gupta, a game changer. "It helped us to opportunities which we never thought of. Today we are innovating things, we are creating things, we are going towards AI, we are providing solutions which can be so beneficial for non-profits." And Gupta sees herself as a pathfinder for other women and girls aspiring to careers in STEM or as entrepreneurs. "[W]e can make space and place for the women who are coming behind us so that we don’t have to keep saying ’women entrepreneurs,’ and maybe in the near future we will just say ’entrepreneurs’."
Results achieved
WD takes a patient, long-term approach to economic development in western Canada. Many investments are multi-year in duration and require several years to realize results and economic outcomes. Consequently, there is more information about activities and outputs than concrete outcomes and economic impacts. Analyzing historical data over a year-by-year basis may not be an accurate way to forecast or compare results. The independent longitudinal study contracted by WD confirms that economic development, and particularly the realization of results, is a long game.
The department uses several sources of data to monitor progress against its performance indicators. Due to the frequency of some surveys and the availability of data, there may be a time lag of up to three years in results for some indicators.
| Departmental results | Performance indicators | Target | Date to achieve target | 2018–19 Actual results | 2019–20 Actual results | 2020–21 Actual results |
|---|---|---|---|---|---|---|
| Businesses are innovative and growing in western Canada | Value of exports of goods from western Canada ($) | $214.0B | March 31, 2021 | $207.7B | $209.5B | $179.7B |
| Revenue growth rate of firms supported by WD programs9 | 10% | March 31, 2021 | 12.3% | 6.4% | 20.3% | |
| Value of exports of clean technologies from western Canada ($) | TBD10 | March 31, 2021 | n/a | $3.5B | $3.5B | |
| Number of high-growth firms in western Canada | 3,550 | March 31, 2021 | 3,680 | 3,440 | 3,780 | |
| Communities are economically diversified in western Canada | Percentage of SMEs that are majority-owned by women, Indigenous people, youth, visible minorities and persons with disabilities in western Canada11 | Women: 15.8% Indigenous: 2.3% Visible minorities: 16.1% Youth: 16.6% Persons with disabilities: 0.3% |
March 31, 2021 | Women: 15.1% Indigenous: 2.2% Visible minorities: 15.1% Youth: 15.7% Persons with disabilities: 0.4% |
Women: 15.1% Indigenous: 2.2% Visible minorities: 15.1% Youth: 15.7% Persons with disabilities: 0.4% |
Women: 15.1% Indigenous: 2.2% Visible minorities: 15.1% Youth: 15.7% Persons with disabilities: 0.4% |
| Amount leveraged per dollar by WD in community projects | 1.0 | March 31, 2021 | 1.1 | 1.1 | 1.0812 | |
| Businesses invest in the development and commercialization of innovative technologies in western Canada | Value of business expenditures in research and development by firms receiving WD program funding ($) | $35.7M | March 31, 2021 | $21.3M | $15.8M | $50.5M |
| Percentage of professional jobs (including science and technology) in western Canada | 33.5% | March 31, 2021 | 32.4% | 32.8% | 35.0% | |
| Percentage of companies engaged in collaborations with higher education institutions in western Canada13 | 9% | March 31, 2021 | 8.8% | 8.8% | 10.2% |
Budgetary financial resources (dollars)
| 2020–21 Main Estimates |
2020–21 Planned spending |
2020–21 Total authorities available for use |
2020–21 Actual spending (authorities used) |
2020–21 Difference (Actual spending minus Planned spending) |
|---|---|---|---|---|
| 261,980,294 | 261,980,294 | 1,044,430,112 | 892,802,350 | 630,822,056 |
Note: The difference in planned and actual spending is related to support of the RRRF.
Human resources (full-time equivalents)
| 2020–21 Planned full-time equivalents |
2020–21 Actual full-time equivalents |
2020–21 Difference (Actual full-time equivalents minus Planned full-time equivalents) |
|---|---|---|
| 232 | 284 | 52 |
Note: The difference in FTE numbers is because of support to the RRRF.
Financial, human resources and performance information for the WD’s Program Inventory is available in GC InfoBase.
Internal Services
Description
Internal Services are those groups of related activities and resources that the federal government considers to be services in support of programs and/or required to meet corporate obligations of an organization. Internal Services refers to the activities and resources of the 10 distinct service categories that support Program delivery in the organization, regardless of the Internal Services delivery model in a department. The 10 service categories are:
- Acquisition Management Services
- Communication Services
- Financial Management Services
- Human Resources Management Services
- Information Management Services
- Information Technology Services
- Legal Services
- Material Management Services
- Management and Oversight Services
- Real Property Management Services
Results
WD’s continued positive results from the Public Service Employee Survey demonstrate that the efforts taken to nurture WD’s workplace culture of employee well-being, inclusivity and achievement are meaningful. We discuss and celebrate our results and reinforce how each employee contributes to a positive work environment and our exceptional results. Nevertheless, areas of improvement for WD include ensuring greater representation of persons with disabilities and promoting greater use of both official languages.
WD examined and revised our departmental learning and equity, diversity and inclusion programs in 2020-21. With a focus on activities that supported the diverse needs of our staff, such as leadership development, equity, diversity and inclusion training, as well as unique employee driven learning needs, we encouraged staff development in the virtual classroom, through independent study and through experiential learning. In addition, our Employee Resource Group for Equity, Diversity and Inclusion launched and will play a critical role in enhancing our inclusive workplace and support our diverse WD workforce.
In 2020-21, WD digitized all employee files and designed a remote working structure so WD’s Compensation Unit could continue to offer high level compensation services while working remotely. WD also continued to be an active participant in PSPC’s Transfer In/Out Project, ensuring employee files transferring to the department were actioned quickly and accurately. Lastly, WD’s Compensation Unit built further internal capacity to meet WD’s growth, ensuring continued client service excellence.
WD’s Communications team provided critical support in helping launch and deliver the RRRF program. This includes not only the messaging and design/posting of public-facing communications materials, but also managing public enquiries about the program (especially status of applications), as well as critical support for call centres and business officers.
The COVID-19 pandemic challenged WD to quickly implement IT solutions in order to adapt to a new working environment. All IMT staff were encouraged to submit their ideas to streamline existing processes. Twenty ideas were submitted of which several were implemented. New video conference (VC) equipment was installed in all WD offices plus the migration to Shared Services Canada’s VC enterprise system. The new equipment provided improved connectivity and functionality for all staff. The introduction of Microsoft Teams also allowed staff to work from home during the COVID-19 pandemic. Lastly, WD’s new grants and contribution system "IRIS" was used as a solution for the RRRF program. WD will continue to improve IRIS this year and will retire our legacy systems prior to March 2022.
In terms of service standards, WD engages in continuous efforts to improve service to the public and to our internal clients and partners. This includes:
- Implementing and adhering to the requirements of the new Treasury Board Policy and Directive on Service and Digital. This took effect on April 1, 2020 and replaced several other policies and directives on service, digital, and information management.
- Quickly developing and delivering new programs and services for COVID-19 relief and recovery.
- Reviewing, and updating if necessary, client service standards and WD’s Service Inventory. The Service Inventory is published on the Government of Canada’s Open Data Inventory portal.
- Regular tracking of client service standard results and publishing them on WD’s public website.
Budgetary financial resources (dollars) – Internal Services
| 2020–21 Main Estimates |
2020–21 Planned spending |
2020–21 Total authorities available for use |
2020–21 Actual spending (authorities used) |
2020–21 Difference (Actual spending minus Planned spending) |
|---|---|---|---|---|
| 12,972,679 | 12,805,099 | 12,920,942 | 14,695,596 | 1,890,497 |
Note: The difference in planned and actual spending is related to support of the RRRF.
Human resources (full-time equivalents) – Internal Services
| 2020–21 Planned full-time equivalents |
2020–21 Actual full-time equivalents |
2020–21 Difference (Actual full-time equivalents minus Planned full-time equivalents) |
|---|---|---|
| 95 | 102 | 7 |
Analysis of trends in spending and human resources
Actual expenditures
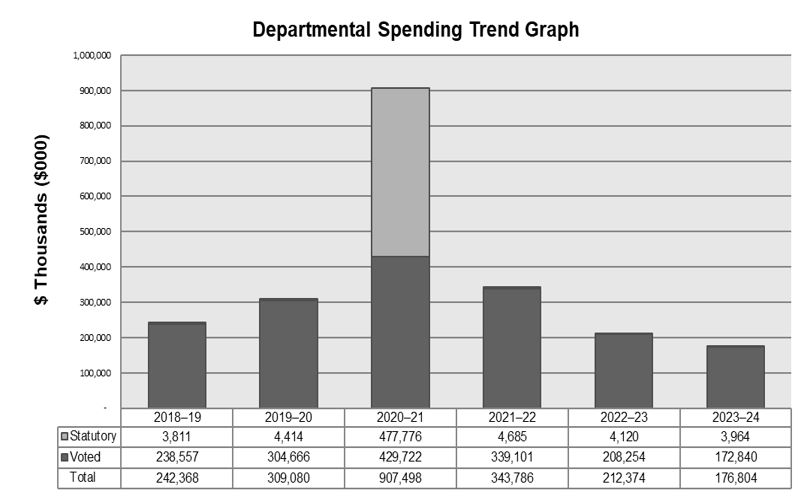
Departmental spending trend graph
The following graph presents planned (voted and statutory spending) over time.
-
Text version of Departmental Spending Graph
2018-19
thousands ($000)2019-20
thousands ($000)2020-21
thousands ($000)2021-22
thousands ($000)2022-23
thousands ($000)2023-24
thousands ($000)Statutory 3,811 4,414 477,776 4,685 4,120 3,964 Voted 238,577 304,666 429,722 339,101 208,254 172,840 Total 242,368 309,080 907,498 343,786 212,374 176,804
The actual and planned spending figures presented in the chart above reflect an increase in 2020-21 from the impact of funding received in response to the COVID-19 pandemic. The Regional Relief and Recovery Fund (RRRF) was introduced to provide support to small and medium sized businesses that were affected. Other funding included Medical Research and Innovation, and Canadian Seafood Processors Fund.
Budgetary performance summary for Core Responsibilities and Internal Services (dollars)
| Core responsibilities and Internal Services | 2020–21 Main Estimates | 2020–21 Planned spending | 2021–22 Planned spending | 2022–23 Planned spending | 2020–21 Total authorities available for use | 2018–19 Actual spending (authorities used) | 2019–20 Actual spending (authorities used) | 2020–21 Actual spending (authorities used) |
|---|---|---|---|---|---|---|---|---|
| Economic Development in western Canada | 261,980,294 | 261,980,294 | 330,416,372 | 200,397,240 | 1,044,430,112 | 228,742,960 | 295,440,866 | 892,802,350 |
| Subtotal | 261,980,294 | 261,980,294 | 330,416,372 | 200,397,240 | 1,044,430,112 | 228,742,960 | 295,440,866 | 892,802,350 |
| Internal Services | 12,972,679 | 12,805,099 | 13,369,956 | 11,976,317 | 12,920,942 | 13,624,581 | 13,639,563 | 14,695,596 |
| Total | 274,952,973 | 274,785,393 | 343,786,328 | 212,373,557 | 1,057,351,054 | 242,367,541 | 309,080,429 | 907,497,946 |
Note: The 2022-23 planned spending still includes planned amounts from BC Region. Please note: (1) this will be recalibrated in future years as a Departmental Plan will be completed for each department, and (2) 2022-23 planned numbers do not include Budget 2021 amounts.
Actual human resources
Human resources summary for core responsibilities and Internal Services
| Core responsibilities and Internal Services | 2018–19 Actual full-time equivalents |
2019–20 Actual full-time equivalents |
2020–21 Planned full-time equivalents |
2020–21 Actual full-time equivalents |
2021–22 Planned full-time equivalents |
2022–23 Planned full-time equivalents |
|---|---|---|---|---|---|---|
| Economic Development in western Canada | 212 | 237 | 232 | 284 | 262 | 219 |
| Subtotal | 212 | 237 | 232 | 284 | 262 | 219 |
| Internal Services | 97 | 97 | 95 | 102 | 92 | 83 |
| Total | 309 | 334 | 327 | 386 | 354 | 302 |
Note: 2022-23 Planned spending figures include for data from PrairiesCan only.
Expenditures by vote
For information on the WD’s organizational voted and statutory expenditures, consult the Public Accounts of Canada 2020–2021.
Government of Canada spending and activities
Information on the alignment of the WD’s spending with the Government of Canada’s spending and activities is available in GC InfoBase.
Financial statements and financial statements highlights
Financial statements
WD’s financial statements (unaudited) for the year ended March 31, 2021, are available on the departmental website.
Financial statement highlights
Condensed Statement of Operations (unaudited) for the year ended March 31, 2021 (dollars)
| Financial information | 2020–21 Planned results |
2020–21 Actual results |
2019–20 Actual results |
Difference (2020–21 Actual results minus 2020–21 Planned results) | Difference (2020–21 Actual results minus 2019–20 Actual results) |
|---|---|---|---|---|---|
| Total expenses | 222,657,332 | 563,852,459 | 246,744,732 | 341,195,127 | 317,107,727 |
| Total revenues | 2,370 | 0 | 446 | (2,370) | (446) |
| Net cost of operations before government funding and transfers | 222,654,962 | 563,852,459 | 246,744,286 | 341,197,497 | 317,108,173 |
WD’s Future-Oriented Statement of Operations (unaudited) for the year ended March 31, 2021, are available on the departmental website.
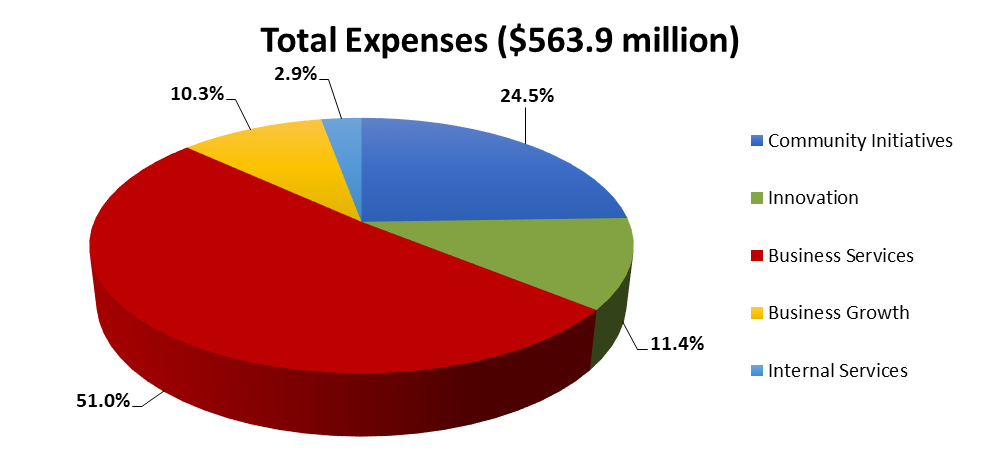
-
Text version of Total Expenses ($563.9 million) chart
Community Initiatives Innovation Business Services Business Growth Internal Services 24.5 % 11.4 % 51 % 10.3 % 2.9 %
Total expenses were $563.9 million in 2020-21, a net increase of $317.1 million (129 percent) over 2019-20. This year-over-year net increase is attributed primarily to additional transfer payment expenses under the Regional Recovery and Relief Fund ($328.1 million), Canadian Seafood Processor’s Fund ($10.2), Regional Innovation Ecosystem ($9.6 million), the Canada Coal Transition Initiative ($4.1 million), Western Diversification Program ($3.5 million), and the Canadian Experiences Fund ($3.0 million) offset by decreased expenses for the Steel and Aluminum Initiative ($24.4 million) and the restoration of the Hudson Bay rail line and reopening of the Port of Churchill ($11.5 million).
Condensed Statement of Financial Position (unaudited) as of March 31, 2021 (dollars)
| Financial information | 2020–21 | 2019–20 | Difference (2020–21 minus 2019–20) |
|---|---|---|---|
| Total net liabilities | 113,295,658.00 | 80,153,182.00 | 33,142,476.00 |
| Total net financial assets | 109,126,445.00 | 77,024,521.00 | 32,101,924.00 |
| Departmental net debt | 4,169,213 | 3,128,661 | 1,040,552.00 |
| Total non-financial assets | 1,711,082 | 1,181,174 | 529,908.00 |
| Departmental net financial position | (2,458,131) | (1,947,487) | (510,644.00) |

-
Text version of Total Net Liabilities ($113.3 million) chart
Accounts payable and accrued liabilities Vacation pay and compensatory leave Employee future benefits 96.3 % 2.7 % 1.0 %
Total net liabilities were $113.3 million at the end of 2020–21, a net increase of $33.1 million (41 percent) over 2019–20. This year-over-year net increase is attributed to the establishment of accounts payable balances for the Regional Recovery and Relief Fund and the Business Scale Up and Productivity (BSP) program.
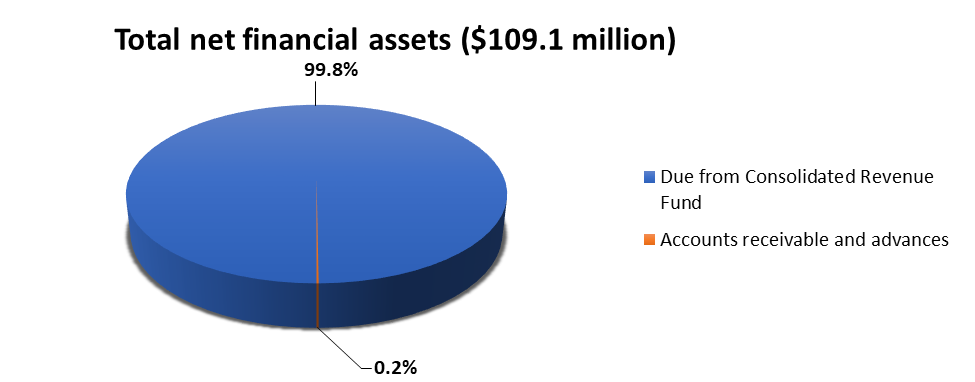
-
Text version of Total net financial assets ($109.1 million) chart
Due from Consolidated Revenue Fund Accounts receivable and advances 99.8 % 0.2 %
Total net financial assets were $109.1 million at the end of 2020–21, an increase of $32.1 million (42 percent) over 2019–20. This year-over-year increase in these assets primarily consists of the "Due from Consolidated Revenue Fund" ($32.3 million), which is used to discharge WD’s liabilities, off-set by a decrease in "Accounts Receivable and Advances" (0.2 million). Given WD’s liabilities were higher than the previous fiscal year, the "Due from Consolidated Revenue Fund" also increased.
Corporate Information
Organizational profile
Appropriate minister: The Honourable Dan Vandal, P.C., M.P., The Honourable Harjit S.
Sajjan, P.C., M.P.
Institutional head: Dylan Jones
Ministerial portfolio: Northern Affairs, International Development
Enabling instrument[s]: Western Economic Diversification Act, R.S.C. 1985, c.11, (4th Supplement)
Year of incorporation / commencement: 1987
Other:
Headquarters:
Edmonton, Alberta
Offices:
Vancouver, British Columbia
Edmonton and Calgary, Alberta
Saskatoon, Saskatchewan
Winnipeg, Manitoba
Ottawa, Ontario
Raison d’être, mandate and role: who we are and what we do
"Raison d’être, mandate and role: who we are and what we do" is available on WD’s website.
For more information on the department’s organizational mandate letter commitments, see the Minister’s mandate letter.
Reporting framework
WD’s Departmental Results Framework and Program Inventory of record for 2020–21 are shown below.
|
Departmental Results Framework |
Core Responsibility: Economic development in western Canada |
Internal Services |
|
|
Departmental result: Businesses are innovative and growing in western Canada |
Indicator: Value of exports of goods from western Canada ($) |
||
|
Indicator: Number of high-growth firms in western Canada |
|||
|
Indicator: Value of exports of clean technologies from western Canada ($) |
|||
|
Indicator: Revenue growth rate of firms supported by WD programs |
|||
|
Departmental result: Communities are economically diversified in western Canada |
Indicator: Percentage of SMEs that are majority-owned by women, Indigenous people, youth, visible minorities and persons with disabilities in western Canada |
||
|
Indicator: Amount leveraged per dollar by WD in community projects |
|||
|
Departmental result: Businesses invest in the development and commercialization of innovative technologies in western Canada |
Indicator: Value of business expenditures in research and development by firm receiving WD program funding ($) |
||
|
Indicator: Percentage of professional jobs (including science and technology) in western Canada |
|||
|
Indicator: Percentage of companies engaged in collaborations with higher education institutions in western Canada |
|||
|
Program Inventory |
Program: Innovation |
||
|
Program: Business Growth |
|||
|
Program: Business Services |
|||
|
Program: Community Initiatives |
|||
Supporting information on the program inventory
Financial, human resources and performance information for WD’s Program Inventory is available in GC InfoBase.
Supplementary information tables
The following supplementary information tables are available on WD’s website:
- Details on transfer payment programs
- Gender-based analysis plus
- Reporting on Green Procurement
- Response to Parliamentary Committee and External Audits
- Up-front multi-year funding
Federal tax expenditures
The tax system can be used to achieve public policy objectives through the application of special measures such as low tax rates, exemptions, deductions, deferrals and credits. The Department of Finance Canada publishes cost estimates and projections for these measures each year in the Report on Federal Tax Expenditures. This report also provides detailed background information on tax expenditures, including descriptions, objectives, historical information and references to related federal spending programs as well as evaluations and GBA+ of tax expenditures.
Organizational contact information
Western Economic Diversification Canada
Suite 1500, 9700 Jasper Avenue
Edmonton, Alberta T5J 4H7
Telephone: 780-495-4164
Fax: 780-495-4557
Email: WD.contactus-contactez-nous.DEO@canada.ca
Web: https://www.wd-deo.gc.ca
Appendix: definitions
appropriation (crédit)
Any authority of Parliament to pay money out of the Consolidated Revenue Fund.
budgetary expenditures (dépenses budgétaires)
Operating and capital expenditures; transfer payments to other levels of government, organizations or individuals; and payments to Crown corporations.
core responsibility (responsabilité essentielle)
An enduring function or role performed by a department. The intentions of the department with respect to a core responsibility are reflected in one or more related departmental results that the department seeks to contribute to or influence.
Departmental Plan (plan ministériel)
A report on the plans and expected performance of an appropriated department over a 3-year period. Departmental Plans are usually tabled in Parliament each spring.
departmental priority (priorité)
A plan or project that a department has chosen to focus and report on during the planning period. Priorities represent the things that are most important or what must be done first to support the achievement of the desired departmental results.
departmental result (résultat ministériel)
A consequence or outcome that a department seeks to achieve. A departmental result is often outside departments’ immediate control, but it should be influenced by program-level outcomes.
departmental result indicator (indicateur de résultat ministériel)
A quantitative measure of progress on a departmental result.
departmental results framework (cadre ministériel des résultats)
A framework that connects the department’s core responsibilities to its departmental results and departmental result indicators.
Departmental Results Report (rapport sur les résultats ministériels)
A report on a department’s actual accomplishments against the plans, priorities and expected results set out in the corresponding Departmental Plan.
experimentation (expérimentation)
The conducting of activities that seek to first explore, then test and compare the effects and impacts of policies and interventions in order to inform evidence-based decision-making, and improve outcomes for Canadians, by learning what works, for whom and in what circumstances. Experimentation is related to, but distinct from innovation (the trying of new things), because it involves a rigorous comparison of results. For example, using a new website to communicate with Canadians can be an innovation; systematically testing the new website against existing outreach tools or an old website to see which one leads to more engagement, is experimentation.
full-time equivalent (équivalent temps plein)
A measure of the extent to which an employee represents a full person-year charge against a departmental budget. For a particular position, the full-time equivalent figure is the ratio of number of hours the person actually works divided by the standard number of hours set out in the person’s collective agreement.
gender-based analysis plus (GBA+) (analyse comparative entre les sexes plus [ACS+])
An analytical process used to assess how diverse groups of women, men and gender-diverse people experience policies, programs and services based on multiple factors including race ethnicity, religion, age, and mental or physical disability.
government-wide priorities (priorités pangouvernementales)
For the purpose of the 2019–20 Departmental Results Report, those high-level themes outlining the government’s agenda in the 2019 Speech from the Throne, namely: Fighting climate change; Strengthening the Middle Class; Walking the road of reconciliation; Keeping Canadians safe and healthy; and Positioning Canada for success in an uncertain world.
horizontal initiative (initiative horizontale)
An initiative where two or more federal organizations are given funding to pursue a shared outcome, often linked to a government priority.
non-budgetary expenditures (dépenses non budgétaires)
Net outlays and receipts related to loans, investments and advances, which change the composition of the financial assets of the Government of Canada.
performance (rendement)
What an organization did with its resources to achieve its results, how well those results compare to what the organization intended to achieve, and how well lessons learned have been identified.
performance indicator (indicateur de rendement)
A qualitative or quantitative means of measuring an output or outcome, with the intention of gauging the performance of an organization, program, policy or initiative respecting expected results.
performance reporting (production de rapports sur le rendement)
The process of communicating evidence-based performance information. Performance reporting supports decision making, accountability and transparency.
plan (plan)
The articulation of strategic choices, which provides information on how an organization intends to achieve its priorities and associated results. Generally, a plan will explain the logic behind the strategies chosen and tend to focus on actions that lead to the expected result.
planned spending (dépenses prévues)
For Departmental Plans and Departmental Results Reports, planned spending refers to those amounts presented in Main Estimates.
A department is expected to be aware of the authorities that it has sought and received. The determination of planned spending is a departmental responsibility, and departments must be able to defend the expenditure and accrual numbers presented in their Departmental Plans and Departmental Results Reports.
program (programme)
Individual or groups of services, activities or combinations thereof that are managed together within the department and focus on a specific set of outputs, outcomes or service levels.
program inventory (répertoire des programmes)
Identifies all the department’s programs and describes how resources are organized to contribute to the department’s core responsibilities and results.
result (résultat)
A consequence attributed, in part, to an organization, policy, program or initiative. Results are not within the control of a single organization, policy, program or initiative; instead they are within the area of the organization’s influence.
statutory expenditures (dépenses législatives)
Expenditures that Parliament has approved through legislation other than appropriation acts. The legislation sets out the purpose of the expenditures and the terms and conditions under which they may be made.
target (cible)
A measurable performance or success level that an organization, program or initiative plans to achieve within a specified time period. Targets can be either quantitative or qualitative.
voted expenditures (dépenses votées)
Expenditures that Parliament approves annually through an appropriation act. The vote wording becomes the governing conditions under which these expenditures may be made.
- Date modified: