
2021–2022 Departmental Results Report
View the print-friendly version: PDF (997 kB)
Western Economic Diversification Canada
Important note about this report
This Departmental Results Report (DRR) is unique in the history of Western Economic Diversification Canada (WD). On August 6, 2021, WD transitioned into two separate agencies – PrairiesCan and PacifiCan. Since this shift occurred in the middle of the fiscal year, it poses a challenge in presenting information in a report that covers the fiscal year in its entirety. This report presents the results and accomplishments for both organizations against the targets as set out in WD’s 2021-22 Departmental Plan. This way, the report tells a complete story.
From 2022-23 onwards, PacifiCan and PrairiesCan will present results in their own reports.
ISSN 2561-0996
Table of contents
- From the Minister of PrairiesCan
- From the Minister of PacifiCan
- From the President
- Results at a glance
- Operating context
- Results: what we achieved
- Spending and human resources
- Corporate Information
- Supporting information on the program inventory
- Supplementary information tables
- Federal tax expenditures
- Organizational contact information
- Appendix: definitions
- Endnotes
From the Minister of PrairiesCan
I am pleased to present the 2021–22 Departmental Results Report for Western Economic Diversification Canada (WD), which is also the first for PrairiesCan. In 2021, I became minister responsible for this new stand-alone regional development agency for Alberta, Saskatchewan and Manitoba, recognizing the unique needs of the Prairie provinces.
We created a stronger, more accessible PrairiesCan for the people and businesses of the region. To achieve better results and ensure our investments are meeting the needs of local communities PrairiesCan is opening seven new service locations, staffed by local experts in their fields, serving communities in seeking greater economic opportunities.
In this report you will learn how PrairiesCan is making a real difference. Our response to the pandemic and how we pivoted to urgently support businesses and supply chains is just one example. The last two years of the pandemic were particularly challenging for businesses, individuals and families. With PrairiesCan as a dedicated partner, delivering timely financial support from Budget 2021, the economy in the Prairies is looking at a strong recovery. Good jobs were preserved and more are being created. Innovative companies have better prospects and opportunities for growth. New community infrastructure projects are underway to bring people back together in their communities revitalizing downtowns and supporting local economies.
The results we are seeing on the Prairies will benefit all Canadians because a stronger Prairie economy contributes to a strong Canadian economy. PrairiesCan is playing a significant strategic role in supporting our businesses and communities, creating inclusive possibilities that increase quality of life. PrairiesCan is full of dedicated public servants with deep roots in the West. They are your neighbours, family and friends and they are committed to a strong, vibrant, prosperous Prairies economy that works for everyone.
Together, over the past year, we have achieved so much, and we have just begun.

The Honourable Daniel Vandal
Minister of Northern Affairs,
Minister responsible for Prairies Economic Development Canada and
Minister responsible for the Canadian Northern Economic Development Agency
From the Minister of PacifiCan
It is my pleasure to present the 2021–22 Departmental Results Report for Western Economic Diversification Canada (WD).
During this past year, WD evolved into two new agencies. I lead PacifiCan, an economic development agency specifically dedicated to British Columbia.
As we recover from the effects of the COVID-19 pandemic and ongoing climate disasters, British Columbians have shown resolve and innovation. And despite the challenges of the last few years, British Columbians are eager to build back a more inclusive, dynamic and robust economy.
By supporting the diversity within businesses and communities, PacifiCan is uniquely invested in the potential and growth of British Columbia. Recognizing that some British Columbians continue to face barriers to full participation in the economy, PacifiCan includes a focus on removing barriers and providing opportunities for under-represented groups, including indigenous communities, women and youth.
PacifiCan has been there for British Columbians, supporting hundreds of projects and helping business and communities invest in a vibrant future, in its inaugural year. Looking forward, PacifiCan will be doing even more to cement its place as an enduring partner for British Columbians. In the coming months, we will be opening new offices throughout the province. Our new PacifiCan officers will be living in and providing service to communities across the province: Victoria; Kelowna; Campbell River; Prince Rupert; Prince George; Fort St. John; Vancouver; and Cranbrook. We will also establish our new headquarters in Surrey.
I invite you to read this report to learn more about the significant strides we have made in PacifiCan’s first year.

The Honourable Harjit S. Sajjan, P.C., OMM, MSM, CD, M.P.
Minister of International Development and
Minister responsible for the Pacific Economic Development Agency of Canada
From the President
This past year, the western Canadian economy emerged from the worst of the pandemic only to confront supply chain challenges, more extreme weather, and Russia’s unjustifiable invasion of Ukraine. Nonetheless, Westerners are resilient people. They are choosing optimism as they breathe life back into hard-hit businesses and communities.
Against this backdrop, I was fortunate to assist in the birth of two new agencies geared to meet the specific needs of two regions in the West. Our dedicated people seamlessly built PacifiCan and PrairiesCan from the foundation of Western Economic Diversification Canada (WD) while delivering five times more funding than in a typical year to support our clients.
The results in this report reflect the can-do spirit of our clients, partners and staff. The results also reflect our unwavering resolve to build good jobs for the future.
I am honoured to have been part of WD, and now, two new successful agencies.

Dylan Jones
President of the Pacific Economic Development Agency of Canada and
Interim President of Prairies Economic Development Canada
Results at a glance
In its final year, 2021-22, Western Economic Diversification Canada (WD) faced some of the largest challenges in its more than three-decade history. WD staff worked hard to support the western economy through the COVID-19 pandemic, all while building two new stand alone regional economic development agencies that will carry on WD’s legacy – PrairiesCan and PacifiCan. From August 2021 onwards, PrairiesCan focuses exclusively on advancing economic development opportunities in the three prairie provinces –Alberta, Saskatchewan and Manitoba. Similarly, PacifiCan was established to focus on the economy of British Columbia.
WD played an important role in the response to the COVID-19 pandemic with the delivery of the Regional Relief and Recovery Fund (RRRF) and the Canadian Seafood Stabilization Fund (CSSF). Throughout the pandemic, WD helped businesses remain open and preserve jobs by providing emergency and ongoing support. When the needs of western Canadian businesses changed, WD and its successor agencies pivoted from providing relief measures to recovery programs through the Government of Canada’s Budget 2021 in six areas: tourism, aerospace, jobs and growth, major festivals, community infrastructure, and Black entrepreneurship. Specifically, 458 projects with funding of $178.6 million was approved under the six Budget 2021 programs.
The department also remained steadfast in delivering its long-standing core economic development programs, such as Regional Economic Growth through Innovation Program and the Community Economic Development and Diversification Program. These programs delivered support for over 450 projects in communities across western Canada to foster healthy businesses, strengthen innovation ecosystems, and promote jobs and growth.
WD supported inclusive economic growth. For example, WD delivered tailored programming to meet the unique needs of Black entrepreneurs, women entrepreneurs, Indigenous entrepreneurs, and entrepreneurs with disabilities. This targeted support continues to provide economic opportunity and remove barriers for underrepresented groups so they can fully participate in the economy.
Throughout the year, PrairiesCan and PacifiCan grew to better serve communities across the West. Completing key activities to establish both organizations – including hiring new staff and working to establish new offices – was particularly demanding as this work occurred at the same time staff were delivering pandemic-related programming and WD’s ongoing core programs.
WD is proud of its 2021-22 achievements. The following are a few of the department’s key results:
- WD’s active projects supported over 12,300 jobs created (including over 7,600 highly qualified jobs) in Western Canada. This included over 1,900 jobs for youth, over 1,700 jobs for women, and 220 jobs for Indigenous Peoples, as self-reported on a voluntary basis.
- From the RRRF’s launch in 2020 to its end in 2022, WD provided relief to over 30,000 western Canadian businesses as they dealt with the effects of the pandemic. The fund is reported to have maintained nearly 52,000 jobs for western Canadians.
- WD clients reported $1.3 billion in export sales growth and $152.9 million in business sales growth resulting from commercialization.
- 2021-22 saw both organizations deliver a near-record amount of funding, with a combined $663.6 million in new approvals for over 1,700 projects. These investments are expected to deliver strong results in the future and will be reported in each organization’s future Departmental Results Reports.
For more information on WD’s plans, priorities and results achieved, see the “Results: what we achieved” section of this report.
Operating context
Economic Overview
Western Canadians continued to show resilience during an economically challenging 2021-22 fiscal year. Early on, the widespread rollout of COVID-19 vaccines and easing of restrictions on businesses and travellers created a rebound of economic activity and optimism. Reopening the economy presented a new set of obstacles, though, as production and supply chains struggled to meet surging demand. Economic optimism was somewhat dampened towards the end of 2021, as new COVID-19 variants and flooding in British Columbia disrupted production, transportation and business operations. The end of the fiscal year brought new challenges as a result of Russia’s illegal and unjustified invasion of Ukraine further impacted the economy.
Despite these challenges, economic growth in most western provinces offset losses from 2020. In 2021, real gross domestic product (GDP) rose in British Columbia (+6.2%), Alberta (+5.1%), and Manitoba (+1.2%),Endnote 1 but declined slightly in Saskatchewan (-0.3%), following severe drought conditions. Compared to 2019, British Columbia’s economy was 2.5% larger. Alberta, Saskatchewan, and Manitoba, though, remained among the furthest from pre-pandemic economic output of all the provinces. Mining, quarrying, and oil and gas extraction were the biggest growth drivers in Alberta and Saskatchewan as production grew in response to the economic rebound.
During the 2021-22 fiscal year, higher prices on commodities like crude oil, natural gas, agricultural products, minerals and forestry products propelled the recovery of western Canadian exports. In 2021, western Canadian exports totalled $246.4 billion (39.1% growth over 2020) and accounted for over 40% of Canada’s exports. In the first quarter of 2022, western Canadian exports were 40% higher than in the first quarter of 2021.
The commodities recovery, along with the reopening of the economy and growing demand, spurred an overall rebound in employment levels from the losses seen in 2020. By March 2022, the western Canadian unemployment rate had fallen to 5.6%, lower than April 2021’s 7.7% and the pre-pandemic rate of 6.2%. All western provinces reached unemployment rates below pre-pandemic levels. However, not all sectors recovered at the same pace. Agricultural employment in western Canada remained the furthest from pre-pandemic employment levels, followed by utilities, and accommodation and food services.
The impacts of the COVID-19 pandemic caused labour markets to tighten and input and borrowing costs to increase through the later part of the 2021-22 fiscal year. However, the number of businesses reporting better business conditions and improved performance expectations increased over the first half of the year.Endnote 2 By January 2022, the number of active businesses in Western Canada was 2% higher than pre-pandemic levels in February 2020.Endnote 3
Strengths
Western Canada’s resources continue to be one of the region’s greatest strengths, where elevated commodity prices benefited the agriculture and energy sectors in particular. Western Canada remained home to a young, entrepreneurial and skilled workforce, which is an indispensable asset to a transforming economy. This contributed to Western Canada’s potential in diverse and growing sectors, including clean technology, value-added agriculture, life and health sciences, digital technology, and advanced manufacturing.
Challenges
In April 2021, inflation rose above 3% in all western provinces. The year saw a steady upward march and by the end of March 2022, inflation had increased to 7.5% in Manitoba, 6.7% in BC, 6.3% in Alberta, and 5.9% in Saskatchewan.Endnote 4 Global inflation remains a challenge for countries around the world impacting businesses and consumers, with the Bank of Canada taking measures to address inflation here in Canada.
Extreme weather events and the impacts of climate change posed challenges in Western Canada. BC’s wildfire season, the third worst on record, triggered a provincial state of emergency from July 20 to September 21, 2021. The Village of Lytton burned to the ground, and more than 1,600 fires burned in BC, roughly the equivalent area of a quarter of Vancouver Island.Endnote 5 After 2021’s severe summer drought, crop production GDP declined by 33.4% in Alberta, and by 25.4% Manitoba. The sector experienced the largest real GDP decline on record (-47%) in Saskatchewan.Endnote 6 In November 2021, heavy rainfall and flooding in BC’s Fraser River Valley resulted in widespread interruption of economic activity and disruptions to major transportation routes.Endnote 7
WD services and support for western Canadians
In 2021-22, WD supported businesses through comprehensive, adaptive programs as they faced supply chain disruptions, labour pressures and rising borrowing costs, caused in part by the COVID-19 pandemic. Through WD-delivered programs, the department helped businesses navigate these challenges, tapping into new export markets and adopting new technologies. WD, now the separate entities of PacifiCan and PrairiesCan, continued to support western Canadians as they faced ongoing challenges related to the COVID-19 pandemic through the RRRF. WD introduced new programs focused on areas such as tourism, aerospace, jobs and growth, community revitalization, and Black entrepreneurship to assist businesses, communities, and their economic partners realize improved economic recovery. Through Business Scale-up and Productivity and Regional Innovation Ecosystems investments, WD continued to support growth, innovation, and diversification of the western economy, through programs that are discussed in more detail in the “Results: what we achieved” section of this report.
Results: what we achieved
Core responsibility: Economic development in western Canada
Description
Western Economic Diversification Canada (WD) promotes growth and diversification in the western Canadian economy by enhancing innovation, improving business competitiveness, promoting the adoption of clean technologies and inclusive growth.
Results
WD advances its core responsibility through longer term economic development programming. WD delivered core programming through the following initiatives:
- Business Scale-up and Productivity (BSP);
- Regional Innovation Ecosystems (RIE);
- Community Economic Development and Diversification (CEDD); and
- Western Canada Business Service Network (WCBSN).
In the 2021-22 fiscal year, project approvals for these programs totaled over $301.7 million in WD funding across 162 projects. This is more than double the amount of funding approved through core programs in 2020-21. WD clients reported results that totaled over 10,000 jobs created, over $1.1 billion in export growth, and over $2.3 billion in revenue growth.
The department also has played a significant role in helping western Canadians through the COVID-19 pandemic and delivered on several new initiatives announced in Budget 2021.
COVID-19 Response Programming
The Regional Relief and Recovery Fund (RRRF) was created to help businesses negatively impacted by the COVID-19 pandemic and unable to access other federal pandemic support programs, or businesses that continued to have liquidity needs. It was originally conceived as a short-term relief fund with a six month duration. However, recognizing the need to continue supports, the program was extended several times. Launched in April 2020 with over $950 million in funding, the RRRF subsequently received top-ups of $600 million (October 2020), $500 million (2020 Fall Economic Statement and Bill C-14) and $80 million (Budget 2021) to meet the overwhelming demand for the program.
Since the RRRF program launch, WD consistently saw much higher volumes of applications than any other regional development agency, and consequently received higher relative amounts of program funding and number of approved applications. Alberta in particular saw very high program demand, receiving as many applications as the other three western provinces combined.
As of the program’s completion at the end of March 2022, WD and its Community Futures (CF) and Women’s Enterprise Initiative (WEI) partners, achieved the following results:
- Allocated nearly $865 million of the over $2.1 billion in national RRRF funds.
- Received over 18,500 applications requesting nearly $1.8 billion in support, with over 1,500 applications requesting nearly $200 million during 2021-22.
- Assisted over 10,000 small and medium-sized enterprises (SMEs) by providing over $715 million in conditionally repayable, repayable, and non-repayable contributions, with over 1,200 recipients receiving nearly $155 million in 2021-22.
Project Spotlight: RRRF
Driftstone Consulting
Business owners from across Western Canada representing a broad range of sectors relied on the RRRF support throughout the pandemic and set up their business for future success. For instance, in the early stages of the COVID-19 pandemic, Driftstone Consulting, a woman-owned engineering firm in Regina, Saskatchewan, was able to meet payroll and support employees until business recovered. This support has allowed the firm to find new opportunities to grow and expand its business.
Project Spotlight: RRRF
The Tunnels of Moose Jaw
The Tunnels of Moose Jaw, a guided tour of the Prohibition-era tunnels under the streets of Moose Jaw, were forced to close in March 2020 from a lack of revenue caused by the pandemic. RRRF support enabled the Tunnels to retain staff, undertake renovations and re-open with a new tour.
Project Spotlight: RRRF
Thompson Okanagan Tourism Association
The Thompson Okanagan Tourism Association (TOTA) is an industry-led, not-for-profit organization representing and supporting business and community tourism interests throughout the Thompson Okanagan region. The RRRF enabled TOTA and its regional partners to deliver business adaptation supports to help rural tourism businesses in British Columbia. Advisors and experts helped tourism operators operationalize health and safety guidelines and adopt new technologies. TOTA also provided detailed data research to improve business efficiency and maximize revenues.
The project resulted in 1,678 businesses created, maintained, or expanded. 91 of these projects are Indigenous-owned and 289 are women-owned, exceeding the target for ownership diversity among funding recipients. Project activities also helped maintain a total of 3,356 jobs, also surpassing expectations.
The design, delivery and completion of the RRRF program provided valuable lessons for WD. The department rapidly deployed staff to assist with the surges in applications as they occurred and created a new unit to handle the repayment and default elements of the program. The need for program flexibility was key in the delivery of the RRRF and highlighted the need for strong records management within the department to capture policy changes from decision through to implementation. The value of this decision became apparent during the Office of the Auditor General’s audit of the RRRF program. The audit showed the program delivered an enormous amount of much-needed financial support to western Canadian businesses. The report also provided recommendations used to inform the design and launch of Budget 2021 COVID-19 relief programs, further reinforcing the importance in the continued improvement of program delivery.
While a full Gender-based analysis plus (GBA+) analysis was not completed during the initial design phase of the RRRF program, the RRRF program collected data for some GBA+ related indicators. Underrepresented groups in Western Canada received a greater proportion of RRRF funds than their representation in the market:
- Rural: RRRF approvals represented nearly two and a half times the percentage of rural SMEs in the marketplace ($294.5 million in funding to 4,716 rural businesses).
- Women-owned: RRRF approvals represented nearly double the percentage of women-owned SMEs in the marketplace ($140.6 million in funding to 2,715 women-owned/led businesses).
- Indigenous-owned: RRRF approvals represented over twice the percentage of Indigenous-owned SMEs in the marketplace ($20.1 million in funding to 350 Indigenous-owned/led businesses).
Budget 2021 initiatives
In 2021-22, WD delivered new programming announced in Budget 2021. Specifically, 458 projects with funding of $178.6 million were approved under the following Budget 2021 programs:
- Jobs and Growth Fund
- Canada Community Revitalization Fund
- Tourism Relief Fund
- Aerospace Regional Recovery Initiative
- Black Entrepreneurship Fund
- Major Festivals and Events Support Initiative
These investments supported western Canadians businesses and communities, and are expected to deliver strong results in upcoming results reports since many of the projects are multi-year in duration with results expected in the near future.
Jobs and Growth Fund
WD launched the Jobs and Growth Fund (JGF) program in July 2021. JGF provides funding to businesses and organizations to help create jobs and position local economies for long-term growth. In 2021-22, WD provided JGF funding to 17 businesses and organizations. These are often long-term investments, and are expected to create over 860 jobs and $187 million in export sales growth in the coming years.
Canada Community Revitalization Fund (CCRF)
The Canada Community Revitalization Fund’s (CCRF) purpose is to support not-for-profit organizations, municipalities, other public institutions, and Indigenous communities on the road to economic recovery. Projects are intended to assist with community vitality, support social and economic cohesion, and bring people back to public spaces safely following COVID-19 public health measures. The CCRF also acts as an economic driver, creating jobs and stimulating local economies. WD received an allocation of approximately $152 million over two years.
As of March 31, 2022, the program reported successful initial results. For example, WD supported at least 179 communities across Western Canada, created 74 jobs, maintained 43 jobs, and helped to renovate 18 community spaces. More results are expected in 2022-23.
Project Spotlight: CCRF
Town of Coalhurst, AB
The Town of Coalhurst, a small town in southern Alberta, located 15 km northwest of Lethbridge, serves a population of 2,668. WD’s investment of $269,068 helped the Town build pathways providing Coalhurst residents with safe spaces to walk, run, ride bikes, and enjoy other outdoor activities. The pathway includes a section along an irrigation canal where birds, small wildlife and natural vegetation can be found. This investment provided better access to these areas for residents to enjoy the outdoors, and enhance well-being during a time where there were risks associated with being indoors and with large groups of people. Paving the paths created a smooth surface for better access for people with mobility aids. Benches allowed those with mobility difficulties to sit and rest when needed. The project created two new jobs, maintained one job, and improved two community spaces benefitting the well-being of the community.
Project Spotlight: CCRF
Town of Athabasca, AB
The Town of Athabasca, Alberta, serves a population of 3,000 people. WD’s investment of $150,000 helped the town rehabilitate its river front stage. The renewed stage includes an access ramp and will serve as the community’s primary venue for the performing arts, civic engagement, community celebrations, and private events. The project created five jobs, maintained one job, and improved one community space again benefitting to the social well-being of the community.
Results acheived
Gender-based analysis plus (GBA+)
WD programs support businesses owned or majority-led by underrepresented groups, such as Indigenous peoples, women, youth, 2SLGBTQI+, persons with disabilities, newcomers to Canada and members of official language minority communities. Programming aims to increase participation of underrepresented groups in the economy by supporting businesses directly or through not-for-profit organizations by providing funding, business services, training and access to resources.
To enhance data collection and ensure consistency of gender and diversity data on all WD applicants, a diversity and inclusion section was added to all application forms. This allows WD to compile aggregate information for diverse groups on the ownership and/or leadership of the organizations applying to WD programs. From this data, WD could identify potential access issues, make evidence-based decisions, and monitor progress towards improved access to programs and services.
Furthermore, WD supports research and study of entrepreneurial data to identify gaps, and better understand unique challenges faced by certain under represented groups. This informs future program parameters and design.
WD commissioned The Centre for Innovation Studies to launch Global Entrepreneurship Monitor (GEM) studies across the West to better understand the unique challenges faced by women and youth in entrepreneurship. WD also invested in a GEM study on the COVID-19 pandemic’s impact on entrepreneurship in Western Canada. In 2021-22, a renewed GEM study was initiated. Results and summary reports on women and youth in Western Canada as well as regional entrepreneurship in Saskatchewan and Manitoba, are expected in 2022-23.
2030 Agenda for Sustainable Development
WD supports the Government of Canada’s efforts to address the United Nations (UN) 2030 Agenda and the UN Sustainable Development Goals (SDGs) by promoting growth and diversification, sustainability, and inclusivity in the western Canadian economy. This includes investments in clean technology and clean resource projects (27 projects approved for a total funding amount of $44.1 million), helping communities transition their economies away from coal-fired electricity generation, and adopting practices that promote sustainable development in the department’s internal operations.
The department’s programs and services advance the following UN Sustainable Development Goals:
- SDG 8 – Decent Work and Economic Growth
- SDG 9 – Industry, Innovation and Infrastructure
Experimentation
WD is a learning organization that is constantly finding ways to innovate and improve its services and program delivery. Examples include:
- Introducing a new portal that allows clients to sign-in securely through a Government of Canada GCKey or Canadian online banking service. This client portal provides the ability to open, save, submit and retrieve applications for COVID-19 relief and recovery and core funding programs.
- Implementing the #ProudlyPrairiesCan social media mentorship program as part of a new digital marketing strategy that enrolled PrairiesCan staff acting as brand ambassadors on a volunteer basis to amplify departmental initiatives and the success of its clients and proponents on their social media channels.
In the sections that follow, WD’s results are organized by the three departmental results contained in its Departmental Results Framework (DRF): Businesses, Communities and Technologies.
Departmental Result: Businesses are innovative and growing in western Canada
WD aims to support western Canadian businesses as they innovate, scale up and pursue long term competitiveness and growth. WD programming is delivered in three different ways—directly to businesses, through ecosystem organizations, and through community support to drive local economic development.
To capture the impact of this departmental result, WD tracks the following four performance indicators:
| Performance indicators | Target | Date to achieve target | 2019–2020 Actual results | 2020–2021 Actual results | 2021–2022 Actual results |
|---|---|---|---|---|---|
| Value of exports of goods from western Canada ($) | $181.8B | March 31, 2022 | $209.5B | $179.7B | $294.6BEndnote 8 |
| Value of exports of clean technologies from western Canada ($) | $3.3B | March 31, 2022 | $3.5B | $3.5B | $3.5BEndnote 9 |
| Revenue growth rate of firms supported by WD programsEndnote 10 | 7% | March 31, 2022 | 6.4% | 20.3% | 13.5% |
| Number of high-growth firms in western Canada | 3,779 | March 31, 2022 | 3,440 | 3,780 | 4,490Endnote 11 |
WD met or exceeded its target for all four indicators in 2021-22. The department’s investments generated 8,423 jobs, over $1.7 billion in revenue growth and approximately $1 billion in export sales growth for its clients. These results were delivered through several programs including the Regional Innovation Ecosystems (RIE).
Regional Innovation Ecosystems
The Regional Innovation Ecosystems (RIE) program aims to create, grow and nurture inclusive regional ecosystems that support businesses throughout the innovation continuum, and foster an entrepreneurial environment conducive to innovation, growth and competitiveness. Through the RIE program, WD provided $140.7 million in multi-year assistance for 67 innovation-related projects in 2021-22.
WD made targeted RIE investments in not-for-profit organizations that provide support to businesses, including in critical sectors where Western Canada has the potential to have a leadership position and more opportunities for growth. These investments created 5,500 jobs, assisted 4,800 SMEs, and led to $2.5 million in business sales growth from commercialization in support of the Government of Canada Innovation & Skills Plan.
Project Spotlight: RIE
The Saskatchewan Health Authority (SHA)
The Saskatchewan Health Authority (SHA) received $3.5M in RIE assistance to establish a pan-Canadian integrated health network (CAN Health) to facilitate the commercialization and adoption of Canadian-developed technology solutions, enabling SMEs to scale and grow in Canada and reach international markets. The project developed health care solutions that assisted front line workers in improving the efficiency of their work. To date, WD funding has helped eight SMEs, resulting in the creation of 165 highly-qualified personnel (HQP) jobs, delivering three technologies to market and generating $36M in revenue growth in 2021-2022.
Project Spotlight: RIE
Assiniboine Community College
The Assiniboine Community College (ACC) received a $525,600 contribution to increase skills training to meet the growing demand for food processors in the Agri-Food sector in southwest Manitoba. The ACC is developing and delivering a food processing certificate program to support labour market development needs identified by local meat processing companies. WD’s investment is supporting the purchase and installation of new equipment, enabling the ACC to provide training to students in an industrial meat processing laboratory setting. The project was financially sustainable and saw high engagement from international students. Participants were able to easily transition into the industry upon completion of the program. This investment is expected to provide long-term economic benefits for the region.
Project Spotlight: RIE
Alacrity Foundation of BC
The Alacrity Foundation of BC (Alacrity) supports the British Columbia clean tech sector to assess target market opportunities, increase export sales, accelerate foreign direct investment and create good jobs. Alacrity Foundation used RIE funding towards consultation, training development, promotional materials, and supports to boost industry presence in target markets. Alacrity’s participation in the RIE program has helped western BC’s clean tech sector grow by $16 million in export sales and $47 million in foreign direct investment. To date, Alacrity has assessed 98 BC clean tech companies on their market-readiness for scale-up, and supported the creation, maintenance, or expansion of 55 businesses—12 of which are majority-owned by women. Alacrity helped create 66 HQP jobs for women and 82 HQP jobs for youth, exceeding expectations ahead of the project’s 2023 end date.
The Regional Air Transportation Initiative (RATI) is a national initiative to help regional and local air carriers and airports that are critical regional transportation hubs or fill essential gaps. RATI support enabled the air transportation system across Western Canada to remain operational through the COVID-19 pandemic and continue to support economic growth in western communities. The pandemic continued to impact the level of staff available to a number of WD clients, effecting the delivery of the program within its initial timeframe. As a result, the initiative was extended to March 31, 2023.
Since its launch in March 2021, 40 projects were approved, with approved funding totaling $52.9 million. Investments through RATI have created 68 jobs, maintained 1,389 jobs, saw 197 communities have air access maintained and/or restored, and 232 air routes maintained or restored.
Project Spotlight: RATI
Brandon Airport
The Brandon Airport (YBR) plays a vital role in connecting the City of Brandon with key northern and western mining, oil and forestry centres. The pandemic caused a 95% reduction in the number of regularly scheduled flights and passenger volumes in 2020 at YBR impacting the airport’s ability to stimulate aviation growth and maintain operations. WD’s support of $455,750 through RATI, enabled YBR to accommodate increased passenger volumes and helped preserve regional transportation connectivity, tourism and the movement of vital supplies, medicines, cargo, and passengers in western Manitoba and eastern Saskatchewan.
In 2022, with the support of RATI, YBR was able to reinstate air routes to 75% of pre-pandemic levels and restore 35 jobs. Operations and services for the regional airport were able to continue while modernization measures were implemented to maintain and improve operations.
Throughout its implementation, the department noticed opportunities within RATI to streamline the project approval process and accelerate the impact of WD supports. As a result, the department will consider increased flexibility in the future design of its programs which includes seeking timeframe extensions when appropriate.
Departmental Result: Communities are economically diversified in Western Canada
WD aims to help communities across the West access economic development opportunities and build resilience. The department works to increase the participation of underrepresented groups in the economy and ensure economic growth is inclusive and leaves no one behind.
To capture the impact of this departmental result, WD tracks the following two indicators:
| Performance indicators | Target | Date to achieve target | 2019–2020 Actual results | 2020–2021 Actual results | 2021–2022 Actual resultsEndnote 12 |
|---|---|---|---|---|---|
| Percentage of SMEs that are majority-owned by women, Indigenous people, youth, visible minorities and persons with disabilities in western CanadaEndnote 13 | Women: 15.3% Indigenous: 2.2% Visible minorities: 15.4% Youth: 16.0% Persons with disabilities: 0.4% |
March 31, 2022 | Women: 15.1% Indigenous: 2.2% Visible minorities: 15.1% Youth: 15.7% Persons with disabilities: 0.4% |
Women: 15.1% Indigenous: 2.2% Visible minorities: 15.1% Youth: 15.7% Persons with disabilities: 0.4% |
Women: 15.4% Indigenous: 1.8% Visible minorities: 8.8% Youth: 14.8% Persons with disabilities: 0.9% |
| Amount leveraged per dollar by WD in community projects | 1.0 | March 31, 2022 | 1.1Endnote 14 | 1.08Endnote 15 | 1.2 |
WD exceeded one of its two indicators in 2021-22. Based on 2020 data, WD met its target for the percentage of SMEs majority-owned by women and persons with disabilities in Western Canada. The department did not achieve its target for the percentage of SMEs majority-owned by Indigenous people, youth and visible minorities in Western Canada. While the department did not achieve these targets, the impacts of the COVID-19 pandemic disproportionately affected these groups exacerbating economic challenges.Endnote 16
The department’s investments under this departmental result generated 577 jobs and over $19.2 million in revenue growth.
WD’s Community Economic Development and Diversification (CEDD) stream distributed $52.1 million in multi-year assistance for 27 projects to support economic development initiatives and contribute to the growth and diversification of Western communities. These projects focus on growing local economies, building economic resiliency, increasing community capacity, and helping communities fully participate in and benefit from economic opportunities.
Project Spotlight: CEDD
Manitoba Music Industry Association Inc.
The Manitoba Music Industry Association Inc. project developed the skills and business knowledge of Indigenous and Francophone music industry workers increasing capacity of artists and companies to succeed in the global music marketplace. As a result of this project, many artists including Ila Barker, Rayannah, and Kelly Bado successfully increased their business opportunities.
Ila Barker is a Winnipeg-based Anishinaabe and settler folk-soul musician. As an emerging artist, Ila participated in the 2021 Market Builder Toronto residency and the 2022 ASKIY residency to share and learn artist development strategies and make potential music contacts. Barker was able to learn from international contacts and export business strategy. As a result of this work, she has successfully written grant applications to support her album and developed her release strategy.
In 2019, Rayannah was named ‘Francophone Artist of the Year’ and ‘Producer of the Year’ along with her colleague Mario Lepage at the Western Canadian Music Awards. Rayannah and Mario were the first francophones ever to receive this honour. Rayannah has been engaged with Manitoba Music throughout the project including showcases at Coup de coeur francophone in Montreal in 2018 and Voix de Fete in Switzerland, among others.Through these events, Rayannah has built a strong framework from which to relaunch her touring career post-pandemic, including booking agents in Germany and Latin America, and booking and publishing in Belgium.
Weaving in influences from her African heritage, la chanson française, and American gospel, Kelly Bado’s music crosses cultural barriers to bring people together in joy and hope. Kelly participated in showcase and business development events including Mundial festival and conference in Montreal in 2019 and Rame à la rencontre in Montreal in 2020. She has since signed with a US-based booking agency and is poised for more international touring in the year ahead.
An additional primary delivery mechanism through WD is the Western Canada Business Service Network (WCBSN). The WCBSN is a network of more than 100 independent organizations—including Community Futures (CF), the Women’s Enterprise Initiative (WEI), the Francophone Economic Development Organizations (FEDOs), Small Business Services (SBS), Indigenous Business Development Services (IBDS) and Entrepreneurs with Disabilities Program (EDP)—that receive WD funds to help western Canadians start, grow and expand their businesses.
Throughout the pandemic, the WCBSN assisted clients to shift or streamline operations, seek new sales channels, and enhance their business skills to maintain their businesses and retain jobs. In 2021-22, the WCBSN provided more than 166,000 information and advisory services to their clients.
WCBSN assisted 7,400 businesses in starting or expanding their operations, and served more than 40,000 clients providing targeted business supports to rural entrepreneurs, Indigenous peoples, women, youth, persons with disabilities, and members of Official Languages Minority Communities (OLMC). The CFs and WEIs experienced significant demands for services with the extended delivery of RRRF in addition to regular core programming. Core activities included the delivery of 833 CF loans valued at $50.1 million to rural SMEs and 96 WEI loans valued at over $7.4 million to women-owned SMEs. These loans created or maintained a combined total of over 3,400 jobs across Western Canada.
Project Spotlight: RRRF
(partially delivered by CFs and WEIs)
CF and WEI continued to deliver RRRF emergency relief loans to rural and women entrepreneurs in 2021-22. Over a 17-month period, the CFs and WEIs processed RRRF loan volumes normally seen over a three-to five-year period. The CFs approved $212.6 million in RRRF loans for 4,467 rural SMEs, which created or maintained over 23,300 jobs, while the WEIs approved nearly $18.7 million in RRRF loans for 515 women-owned SMEs, with over 1,900 jobs created or maintained. Loan approvals by CF and WEI for underrepresented groups include SMEs owned by women ($88.4 million), Indigenous peoples ($12.3 million), youth ($8.5 million), persons with disabilities ($6.5 million), and Francophones ($4.6 million).
An analysis of data from CF’sEndnote 17 loan clients, compared to companies of similar size and location in Statistics Canada’s database, demonstrated better results in comparison by CF clients. These results are as follows:
- In terms of employment growth from 2014 to 2019,Endnote 18 CF-assisted firms collectively increased their number of employees by 7.98 percent compounded annually compared to 0.22 percent in non-assisted firms.
- In terms of sales growth from 2014 to 2019, CF-assisted firms exhibited 8.43 percent compounded annual sales growth rate compared to 3.14 percent for non-assisted firms. In addition, CF loan clients were able to withstand initial shocks due to economic activity better than firms without CF assistance. Sales growth of CF-assisted firms also tended to outperform sales growth of comparable firms during periods of economic slowdown.
- PrairiesCan CF-assisted firms exhibited significantly stronger longevity at 60 percent for a five-year survival rate than non-assisted firms at 44 percent.
- PacifiCan CF-assisted firms also exhibited significantly stronger longevity at 63 percent for a five-year survival rate than non-assisted firms at 47 percent.
The Francophone Economic Development Organizations (FEDOs), members of the OLMCs in Western Canada, continued to deliver the three-year (2020-2023), $1.8 million pilot Pan-West Francophone Economic Development Fund. In the initiative’s second year, the FEDOs approved 21 community projects worth $563,000 to support Francophone immigrant entrepreneurs, enhance tourism infrastructure and promote the green economy through youth engagement and tourism.
Project Spotlight: FEDO (MB)
J’em Bistro
Support through the FEDOs helped Manitoba’s J’em Bistro. J’em Bistro is owned and operated by Josée Curé in St. Pierre Jolys, an Official Language Minority Community in Manitoba. When the COVID-19 pandemic forced their dining room to close, Chef Curé reached out to “le Conseil de développement économique du Manitoba (CDEM)”, the Francophone Economic Development Organization that serves Manitoba, to find ways to stay in business. CDEM provided business services that helped J’em Bistro to diversify its revenue streams like creating online baking classes and take-out picnic baskets for outdoor activities.
The Entrepreneurs with Disabilities Program (EDP) provides western Canadians with disabilities access to business information, training and development, one-on-one counselling services and mentorships, and financial supports in their pursuit of self-employment and entrepreneurship.
Project Spotlight: EDP
Ross McCreery Photography
With support from the South Saskatchewan Independent Living Centre (SSILC) in Regina, SK, Ross McCreery received the support he needed to turn his photography hobby into Ross McCreery Photography, while balancing the physical demands and limitations of a disability. He offers custom photography artwork and trains other business owners in photography and image editing. Not only did services provided by SSILC help him launch his business and grow his self-esteem and confidence, he gained a renewed sense of purpose and means to build a successful business and help others living with disabilities do the same.
“South Saskatchewan Independent Living Centre was not only key in helping me grow my business, but in helping me find my self-esteem and, in turn, I was able to help other entrepreneurs with disabilities.” –Ross McCreery
To learn more about his success story, click on this video.
Departmental Result: Businesses invest in the development and commercialization of innovative technologies in western Canada
WD supports firms at many levels of maturity to commercialize new technologies, scale up operations, and improve productivity. Most of WD’s support in this area involves directly supporting businesses as they accelerate growth through productivity improvements, business scale up and technology commercialization.
To capture the impact of this department result, WD tracks the following three indicators:
| Performance indicators | Target | Date to achieve target | 2019–2020 Actual results | 2020–2021 Actual results | 2021–2022 Actual results |
|---|---|---|---|---|---|
| Value of business expenditures in research and development by firms receiving WD program funding ($) | $14.2M | March 31, 2022 | $15.8M | $50.5M | $77.9MEndnote 19 |
| Percentage of professional jobs (including science and technology/S&T) in western Canada | 32.8% | March 31, 2022 | 32.8% | 35.0% | 35.3%Endnote 20 |
| Percentage of companies engaged in collaborations with higher education institutions in Western CanadaEndnote 21 | 8.8% | March 31, 2022 | 8.8% | 10.2% | 10.2%Endnote 22 |
WD met or exceeded all three of its indicators under this departmental result in 2021-22. The department’s investments to support the development and commercialization of technologies generated strong results for WD clients. For example, the 259 projects reporting results in 2021-22 reported: 3,286 jobs created, of which 2,271 were highly qualified personnel (HQP), $152.9 million business sales growth resulting from commercialization, $221.8 million in export sales growth and a total of 15 instances of protection of intellectual property exercised.
WD primarily used two programs to support the development and commercialization of innovative technologies in Western Canada. The first being the Business Scale-up and Productivity (BSP) Program, which aims to help companies scale up, improve productivity and commercialize technologies. Through this program, WD supports high growth businesses directly by offering interest free repayable funding. In 2021-22,WD had 68 projects and $109.3 million worth of WD funding allocated under BSP.
Project Spotlight: BSP
Sonar Software Inc.
Sonar Software Inc. received $3 million in BSP funding to commercialize the next generation of billing software for internet service providers (ISPs). Located in DeBolt, a rural community near Grande Prairie, AB, Sonar has been serving the large and growing ISP market with its integrated billing software with features that assist with quoting, ticketing, payments, inventory management, work force scheduling, network monitoring, and service provisioning. Since receiving BSP funding in 2019, Sonar has grown its revenue to $12.4 million, created 46 HQP jobs and 21 non-HQP jobs.
Project Spotlight: BSP
Prairie Fava Ltd.
Glenboro, Manitoba based Prairie Fava received $1 million in BSP funding to scale up its manufacturing capabilities and commercialize new value-added fava bean-based food ingredients, such as whole fava beans, de-hulled fava beans, raw fava flour and pre-cooked fava flavouring. Prairie Fava is a woman-owned business, and has so far achieved cumulative revenue growth of over $2.1 million, including $1.2 million in export sales growth. Prairie Fava has also created three new HQP positions and two new non-HQP positions in rural Manitoba. Through this project, the company expanded the number of partnerships it has with small-to-medium sized food producers and processors.
Project Spotlight: BSP
Saskarc Inc.
As a custom-fabricator operating in Oxbow, a small community in southeast Saskatchewan, Saskarc Inc. (Saskarc) traditionally served clients in the oil and gas sector. However, with changes in the sector, the company identified an opportunity to diversify into structural steel projects in airports, bridges and stadiums. In 2020, WD approved over $800,000 in BSP assistance toward a $4.14 million project to purchase and install robotic assembly and welding equipment helping Saskarc produce structural steel products. This investment has enabled Saskarc to pursue large contracts in both Canada and the United States helping the company generate $14.3 million in revenue growth, $3.3 million in export sales and created 23 jobs.
The second program through which WD supports innovation and technology commercialization is the Western Innovation Initiative (WINN). WINN was a five-year (2013-2018) federal initiative that offered repayable contributions for SMEs with operations in Western Canada to help move their technologies from the later stages of research and development to the marketplace. Although the initiative is no longer accepting applications, many projects were multi-year in nature. There are currently 107 active WINN projects.
Project Spotlight: WINN
AbCellera Biologics Inc. (BC)
AbCellera Biologics Inc. (AbCellera), a Vancouver-based biotechnology company, uses their proprietary AI-powered platform to research and discover human antibodies to develop therapies. AbCellera received $2.4 million in WINN funding. Most recently, AbCellera received $5 million in BSP funding to scale-up partnerships through marketing and business development, intellectual property licensing, and global capacity expansion. In collaboration with a US pharmaceutical company, AbCellera developed the first US FDA-approved antibody treatment against SARS-COV-2, the virus that caused the COVID-19 pandemic. Through royalty revenues from this breakthrough, AbCellera generated $590 million in revenue and $595 million in export sales, exceeding growth targets. AbCellera created 271 jobs, of which 186 are HQP, and attracted $705 million in foreign direct investment.
Project Spotlight: WINN
JCA Industries
Manitoba-based JCA Industries received $1 million in funding to commercialize a tablet-based precision agriculture platform for farm operators to wirelessly manage machinery for seeding, planting, and spraying applications. Upon project completion, JCA achieved cumulative revenue growth of $4 million, including $1.2 million in export sales growth. The project allowed JCA to create 18 new jobs in Winnipeg, including 12 HQP. In May 2022, JCA Industries was acquired by AGCO, an international manufacturer of agricultural machinery and precision agricultural equipment.
The mandate of WD, to develop and diversify the economy of Western Canada, is a long term commitment. Some clients of WD continue to participate with WD through different program streams as their businesses evolve and grow.
Project Spotlight: WINN and BSP
Biktrix Enterprises Inc.
In 2018, Biktrix Enterprises Inc. (Biktrix), an electric bike manufacturer based in Saskatoon, received $250,000 in WINN assistance for a three-year project to design, test and launch its Hylec bike—a hybrid e-bike capable of switching between street legal and off-road electric motorbike modes. Later, in 2021, WD supported the business with $3.5 million in BSP funding to assist with the scale up as they set their sights on international markets. To date, WD support helped the company double its revenue for four consecutive years. Additionally, the company hired a total of six HQP positions including engineers, technicians and industrial designers, along with two support staff to advance the project.
“Biktrix is thankful to our government for helping us scale our business by investing in us. PrairiesCan investment will help Biktrix catapult our growth by hiring more qualified staff and generating more economic impact through local and export sales.”
–Roshan Thomas, CEO and Founder, Biktrix Enterprises Inc.
With the objective of continuous improvement, WD undertook a review of longer-term economic performance data of WD-assisted recipients. The department has always kept track of short-term performance, and now – with the publication of the Longitudinal Study of WD Clients from 2009-10 to 2019-20 – has an accurate view of the long-term impacts of WD’s assistance to businesses. PrairiesCan and PacifiCan will be using the information to better understand the impact that its strategic investments have on businesses and not-for-profit organizations, and help maximize investor value for taxpayers.
Results achieved
There are three important assumptions that underpin the summary results achieved as contained in the table below, and the three results tables provided earlier in this report.
The department uses several sources of data to monitor progress against its performance indicators. WD presents the most recent data available, sometimes not from the most recent year. The availability of data may lead to a potential misalignment between the result achieved and the fiscal year for the data. More concretely, due to the frequency of some Statistics Canada surveys and the availability of data, there may be a time lag of up to three years in results for some indicators.
WD takes a measured, long-term approach to economic development in Western Canada. Many investments are multi-year in duration and require several years to fully realize results and economic outcomes. Consequently, there is more information about activities and outputs than outcomes and economic impacts. Analyzing historical data over a year-by-year basis is not the best way to forecast or compare results. Instead, independent longitudinal studies offer a method of evaluating economic development results that are realized over the long-term.
It is important to note the targets included in the results tables were set prior to the decision to transition WD into two separate organizations – PrairiesCan and PacifiCan. As such, the numbers reflect the results and accomplishments for both organizations. Both organizations will present their first independent Departmental Results Report for fiscal year 2022-23.
The following table shows, for Economic Development in Western Canada, results achieved, performance indicators, targets and target dates for 2021–22, and the actual results for the three most recent fiscal years for which actual results are available.
| Departmental results | Performance indicators | Target | Date to achieve target | 2019–2020 Actual results | 2020–2021 Actual results | 2021–2022 Actual results |
|---|---|---|---|---|---|---|
| Businesses are innovative and growing in western Canada | Value of exports of goods from Western Canada ($) | $181.8B | March 31, 2022 | $209.5B | $179.7B | $249.6B |
| Revenue growth rate of firms supported by WD programsEndnote 23 | 7% | March 31, 2022 | 6.4% | 20.3% | 13.5% | |
| Value of exports of clean technologies from Western Canada ($) | $3.3B | March 31, 2022 | $3.5B | $3.5B | $3.5B | |
| Number of high-growth firms in Western Canada | 3,779 | March 31, 2022 | 3,440 | 3,780 | 4,490 | |
| Communities are economically diversified in Western Canada | Percentage of SMEs that are majority-owned by women, Indigenous people, youth, visible minorities and persons with disabilities in western CanadaEndnote 24 | Women: 15.3% Indigenous: 2.2% Visible minorities: 15.4% Youth: 16.0% Persons with disabilities: 0.4% |
March 31, 2022 | Women: 15.1% Indigenous: 2.2% Visible minorities: 15.1% Youth: 15.7% Persons with disabilities: 0.4% |
Women: 15.1% Indigenous: 2.2% Visible minorities: 15.1% Youth: 15.7% Persons with disabilities: 0.4% |
Women: 15.4% Indigenous: 1.8% Visible minorities: 8.8% Youth: 14.8% Persons with disabilities: 0.9% |
| Amount leveraged per dollar by WD in community projectsEndnote 25 | 1.0 | March 31, 2022 | 1.1 | 1.08 | 1.2 | |
| Businesses invest in the development and commercialization of innovative technologies in Western Canada | Value of business expenditures in research and development by firms receiving WD program funding ($) | $14.2M | March 31, 2022 | $15.8M | $50.5M | $77.9M |
| Percentage of professional jobs (including science and technology) in Western Canada | 32.8% | March 31, 2022 | 32.8% | 35.0% | 35.3% | |
| Percentage of companies engaged in collaborations with higher education institutions in Western CanadaEndnote 26 | 8.8% | March 31, 2022 | 8.8% | 10.2% | 10.2% |
Financial, human resources and performance information for WD’s Program Inventory is available in GC InfoBase.
Budgetary financial resources (dollars)
This report highlights the accomplishments of both organizations – PrairiesCan and PacifiCan. Due to the restructuring of WD into two regional development agencies midway through the year, PacifiCan launched without a 2021–22 Departmental Plan in place, and without a set of Future Oriented Financial Statements for fiscal year 2021–2022. There are no estimates or planned spending amounts available to provide comparative financial and human resources (full-time equivalent or FTE) information for the fiscal year for PacifiCan. The 2021–22 Main Estimates and planned spending figures were established for WD, and did not change as a result of the transition. PacifiCan’s financial and human resources information is presented in separate tables to show the actual spending and human resources for the period between August 6, 2021 and March 31, 2022.
This way, WD is transparently presenting the entirety of the resources used by both organizations during the fiscal year to achieve the results outlined in this report. Both organizations’ information aligns with information presented in Public Accounts.
The following table shows, for Economic Development for Western Canada, budgetary spending for 2021–22, as well as actual spending for that year.
PrairiesCan:
| 2021–2022 Main Estimates |
2021–2022 Planned spending |
2021–2022 Total authorities available for use |
2021–2022 Actual spending (authorities used) |
2021–2022 Difference (Actual spending minus Planned spending) |
|---|---|---|---|---|
| 330,416,372 | 330,416,372 | 521,336,307 | 418,106,0431 | 87,689,6712 |
Note 1: This is the actual spending of WD from April 1, 2021 to August 5, 2022 and PrairiesCan from August 6, 2021 to March 31, 2022.
Note 2: The difference in PrairiesCan’s planned and actual spending is related to support of the RRRF.
PacifiCan:
| 2021–2022 Main Estimates |
2021–2022 Planned spending |
2021–2022 Total authorities available for use |
2021–2022 Actual spending (authorities used) |
2021–2022 Difference (Actual spending minus Planned spending) |
|---|---|---|---|---|
| Not Available1 | Not Available1 | 263,524,2442 | 164,985,1692 | Not Available1,3 |
Note 1: Information not available prior to the establishment of PacifiCan.
Note 2: These figures represent PacifiCan’s total authorities available for use and actual spending from August 6, 2021 to March 31, 2022. PacifiCan has changed its core responsibility in the Public Accounts as “Economic Development in British Columbia.”
Note 3: The difference in PacifiCan’s authorities available and actual spending is mainly related to Budget 2021 programs, the RRRF, and the LNG Haisla Bridge investment. The majority of spending is on the core economic development programs, RRRF and Regional Air Transport Initiative (RATI).
Financial, human resources and performance information for WD’s Program Inventory is available in GC InfoBase.
Human resources (full-time equivalents)
The following table shows, in full time equivalents, the human resources the department needed to fulfill this core responsibility for 2021–22.
PrairiesCan:
| 2021–2022 Planned full-time equivalents |
2021–2022 Actual full-time equivalents |
2021–2022 Difference (Actual full-time equivalents minus Planned full-time equivalents) |
|---|---|---|
| 262 | 279 | 17 |
PacifiCan:
| 2021–2022 Planned full-time equivalents |
2021–2022 Actual full-time equivalents |
2021–2022 Difference (Actual full-time equivalents minus Planned full-time equivalents) |
|---|---|---|
| Not Available1 | 692 | Not Available1 |
Note 1: Information not available prior to the establishment of PacifiCan.
Note 2: The actual full-time equivalents were for between August 6, 2021 and March 31, 2022.
Financial, human resources and performance information for the WD’s Program Inventory is available in GC InfoBase.
Internal Services
Description
Internal Services are those groups of related activities and resources the federal government considers to be services in support of programs and/or required to meet corporate obligations of an organization. Internal Services refers to the activities and resources of the 10 distinct service categories that support program delivery in the organization, regardless of the Internal Services delivery model in a department. The 10 service categories are:
- Acquisition Management Services
- Communication Services
- Financial Management Services
- Human Resources Management Services
- Information Management Services
- Information Technology Services
- Legal Services
- Material Management Services
- Management and Oversight Services
- Real Property Management Services
Results
One of WD’s most significant achievements in 2021-22 was the establishment of two individual organizations, achieved through dedication and teamwork across organizations. PrairiesCan and PacifiCan entered into a shared services agreement to ensure the transition was done efficiently with minimal impact on clients. PacifiCan secured interim accommodations for each of its new regional service locations as of March 31, 2022, and is assessing interim and long-term options for its new headquarters in Surrey with Public Services and Procurement Canada.
WD staff – later PacifiCan and PrairiesCan staff – undertook significant work to set up both organizations while continuing to deliver core and time-limited programs. This included organizational design work, creating new positions, leasing and equipping office space, and the hiring, onboarding and training of new staff. This was all accomplished in parallel.
Budgetary financial resources (dollars) – Internal Services
The following table shows, for Internal Services, budgetary spending for 2021–22, as well as spending for that year.
PrairiesCan:
| 2021–2022 Main Estimates |
2021–2022 Planned spending |
2021–2022 Total authorities available for use |
2021–2022 Actual spending (authorities used) |
2021–2022 Difference (Actual spending minus Planned spending) |
|---|---|---|---|---|
| 13,369,956 | 13,369,956 | 17,324,080 | 13,747,877 | 377,921 |
PacifiCan:
| 2021–2022 Main Estimates |
2021–2022 Planned spending |
2021–2022 Total authorities available for use |
2021–2022 Actual spending (authorities used) |
2021–2022 Difference (Actual spending minus Planned spending) |
|---|---|---|---|---|
| Not Available1 | Not Available1 | 6,719,531 | 3,720,617 | Not Available2 |
Note 1: Information not available prior to the establishment of PacifiCan.
Note 2: The difference between PacifiCan’s authorities available and actual spending is mainly related to pending staffing and accommodations in establishing a new headquarters in Surrey, setting up BC regional offices, collaboration points and the Ottawa liaison office.
Human resources (full-time equivalents) – Internal Services
The following table shows, in full time equivalents, the human resources the department needed to carry out its internal services for 2021–22.
PrairiesCan:
| 2021–2022 Planned full-time equivalents |
2021–2022 Actual full-time equivalents |
2021–2022 Difference (Actual full-time equivalents minus Planned full-time equivalents) |
|---|---|---|
| 92 | 107 | 151 |
Note 1: The difference between PrairiesCan’s planned and actual FTEs is related to support of the RRRF.
PacifiCan:
| 2021–2022 Planned full-time equivalents |
2021–2022 Actual full-time equivalents |
2021–2022 Difference (Actual full-time equivalents minus Planned full-time equivalents) |
|---|---|---|
| Not Available1 | 8 | Not Available1 |
Note 1: Information not available prior to the establishment of PacifiCan.
Spending and human resources
Actual expenditures
Spending 2019-20 to 2024-25
The following graphs present planned (voted and statutory spending) over time.
PrairiesCan:

-
Text version of PrairiesCan’s Departmental Spending Graph
2019-20
thousands ($000)2020-21
thousands ($000)2021-22
thousands ($000)2022-23
thousands ($000)2023-24
thousands ($000)2024-25
thousands ($000)Statutory 4,414 477,776 5,092 5,404 4,520 4,073 Voted 304,666 429,722 426,762 418,065 233,062 175,427 Total 309,080 907,498 431,854 423,469 237,582 179,500
The overall decrease in PrairiesCan’s voted and statutory spending from 2020-21 to 2021-22 relates to the conclusion of the Regional Relief and Recovery Fund as part of the Government of Canada’s COVID-19 Economic Response Plan.
PacifiCan:

-
Text version of PacifiCan’s Departmental Spending Graph
2019-20
thousands ($000)2020-21
thousands ($000)2021-22
thousands ($000)2022-23
thousands ($000)2023-24
thousands ($000)2024-25
thousands ($000)Statutory n/a n/a 1,201 n/a n/a n/a Voted n/a n/a 167,505 n/a n/a n/a Total n/a n/a 168,706 n/a n/a n/a
Note: PacifiCan’s planned spending was not available from 2022-23 to 2024-25 because PacifiCan did not have a departmental plan (DP) for fiscal year 2021-22 nor a set of Future-Oriented Financial Statements, due to the mid-year timing of the reorganization of WD into PacifiCan and PrairiesCan.
Budgetary performance summary for Core Responsibilities and Internal Services (dollars)
The “Budgetary performance summary for core responsibilities and internal services” table presents the budgetary financial resources allocated for WD’s core responsibility and for internal services.
PrairiesCan:
| Core responsibilities and Internal Services | 2021–2022 Main Estimates | 2021–2022 Planned spending | 2022–2023 Planned spending | 2023–2024 Planned spending | 2021–2022 Total authorities available for use | 2019–2020 Actual spending (authorities used) | 2020–2021 Actual spending (authorities used) | 2021–2022 Actual spending (authorities used) |
|---|---|---|---|---|---|---|---|---|
| Economic Development in western Canada | 330,416,372 | 330,416,372 | 408,443,940 | 224,171,136 | 521,336,307 | 295,440,866 | 892,802,350 | 418,106,043 |
| Subtotal | 330,416,372 | 330,416,372 | 408,443,940 | 224,171,136 | 521,336,307 | 295,440,866 | 892,802,350 | 418,106,043 |
| Internal Services | 13,369,956 | 13,369,956 | 15,024,743 | 13,410,507 | 17,324,080 | 13,639,563 | 14,695,596 | 13,747,877 |
| Total | 343,786,328 | 343,786,328 | 423,468,683 | 237,581,643 | 538,660,387 | 309,080,429 | 907,497,946 | 431,853,920 |
Note: The difference in PrairiesCan’s planned and actual spending is related to support of the RRRF.
PacifiCan:
| Core responsibilities and Internal Services | 2021–2022 Main Estimates | 2021–2022 Planned spending | 2022–2023 Planned spending | 2023–2024 Planned spending | 2021–2022 Total authorities available for use | 2019–2020 Actual spending (authorities used) | 2020–2021 Actual spending (authorities used) | 2021–2022 Actual spending (authorities used) |
|---|---|---|---|---|---|---|---|---|
| Economic Development in British Columbia1 | Not Available3 | Not Available3 | Not Available3 | Not Available3 | 263,524,244 | Not Available3 | Not Available3 | 164,985,1692 |
| Subtotal | Not Available3 | Not Available3 | Not Available3 | Not Available3 | 263,524,244 | Not Available3 | Not Available3 | 164,985,169 |
| Internal Services | Not Available3 | Not Available3 | Not Available3 | Not Available3 | 6,719,531 | Not Available3 | Not Available3 | 3,720,6172 |
| Total | Not Available3 | Not Available3 | Not Available3 | Not Available3 | 270,243,775 | Not Available3 | Not Available3 | 168,705,786 |
Note 1: PacifiCan used a Departmental Results Framework (DRF) and Program Inventory (PI) that was consistent with WD’s on an interim basis until its DRF and PI officially came into effect on April 1, 2022. PacifiCan has changed its core responsibility in the Public Accounts as “Economic Development in British Columbia”.
Note 2: The difference in authorities available and actual spending is mainly related to Budget 2021 programs, Regional Relief and Recovery Fund (RRRF), and LNG Haisla Bridge. The majority of spending is on the core economic development programs, RRRF and Regional Air Transport Initiative (RATI). Under Internal Services, the difference in authorities available and actual spending is mainly related to pending staffing and accommodations in establishing a new headquarters in Surrey, setting up BC regional offices, collaboration points and the Ottawa liaison office.
Note 3: Information not available prior to the establishment of PacifiCan.
Actual human resources
The “Human resources summary for core responsibilities and Internal Services” table presents the full-time equivalents (FTEs) allocated to WD’s core responsibility and to internal services.
Human resources summary for core responsibilities and Internal Services
PrairiesCan:
| Core responsibilities and Internal Services | 2019–2020 Actual full-time equivalents |
2020–2021 Actual full-time equivalents |
2021–2022 Planned full-time equivalents |
2021–2022 Actual full-time equivalents |
2022–2023 Planned full-time equivalents |
2023–2024 Planned full-time equivalents |
|---|---|---|---|---|---|---|
| Economic Development in western Canada | 237 | 284 | 262 | 279 | 259 | 232 |
| Subtotal | 237 | 284 | 262 | 279 | 259 | 232 |
| Internal Services | 97 | 102 | 92 | 107 | 115 | 103 |
| Total | 334 | 386 | 354 | 386 | 374 | 335 |
PacifiCan:
| Core responsibilities and Internal Services | 2019–2020 Actual full-time equivalents |
2020–2021 Actual full-time equivalents |
2021–2022 Planned full-time equivalents |
2021–2022 Actual full-time equivalents |
2022–2023 Planned full-time equivalents |
2023–2024 Planned full-time equivalents |
|---|---|---|---|---|---|---|
| Economic Development in British Columbia | Not Available1 | Not Available1 | Not Available1 | 69 | Not Available2 | Not Available2 |
| Subtotal | Not Available1 | Not Available1 | Not Available1 | 69 | Not Available2 | Not Available2 |
| Internal Services | Not Available1 | Not Available1 | Not Available1 | 8 | Not Available2 | Not Available2 |
| Total | Not Available1 | Not Available1 | Not Available1 | 77 | Not Available2 | Not Available2 |
Note 1: Information not available prior to the establishment of PacifiCan.
Note 2: PacifiCan’s planned FTEs were not presented in WD’s 2021-22 Departmental Plan.
Expenditures by vote
For information on WD’s and PacifiCan’s organizational voted and statutory expenditures, consult the Public Accounts of Canada 2022.
Government of Canada spending and activities
Information on the alignment of the WD’s spending with the Government of Canada’s spending and activities is available in GC InfoBase.
Financial statements and financial statements highlights
Financial statements
WD’s/PrairiesCan’s financial statements (unaudited) for the year ended March 31, 2022, are available on the departmental website.
PacifiCan’s financial statements (unaudited) for the year ended March 31, 2022, are available on the agency’s website.
Financial statement highlights
Condensed Statement of Operations (unaudited) for the year ended March 31, 2022 (dollars)
PrairiesCan:
| Financial information | 2021–2022 Planned results |
2021–2022 Actual results |
2020–2021 Actual results |
Difference (2021–2022 Actual results minus 2021–2022 Planned results) | Difference (2021–2022 Actual results minus 2020–2021 Actual results) |
|---|---|---|---|---|---|
| Total expenses | 297,012,450 | 281,812,762 | 563,852,459 | (15,199,688) | (282,039,697) |
| Total revenues | 1,030 | 1,110 | 0 | 80 | 1,110 |
| Net cost of operations before government funding and transfers | 297,011,420 | 281,811,652 | 563,852,459 | (15,199,768) | (282,040,807) |
PacifiCan:
| Financial information | 2021–2022 Planned results |
2021–2022 Actual results |
2020–2021 Actual results |
Difference (2021–2022 Actual results minus 2021–2022 Planned results) | Difference (2021–2022 Actual results minus 2020–2021 Actual results) |
|---|---|---|---|---|---|
| Total expenses | Not Available1 | 104,170,620 | Not Available1 | Not Available1 | Not Available1 |
| Total revenues | Not Available1 | 0 | Not Available1 | Not Available1 | Not Available1 |
| Net cost of operations before government funding and transfers | Not Available1 | 104,170,620 | Not Available1 | Not Available1 | Not Available1 |
Note 1: Information not available prior to the establishment of PacifiCan. PacifiCan’s Future-Oriented Statement of Operations (unaudited) for the year ended March 31, 2022 was not in place.

Text version: PrairiesCan Total Expenses ($281.8 million) chart
| Community Initiatives | Innovation | Business Services | Business Growth | Internal Services |
|---|---|---|---|---|
| 39.3% | 26.1% | 16.5% | 12.5% | 5.6% |
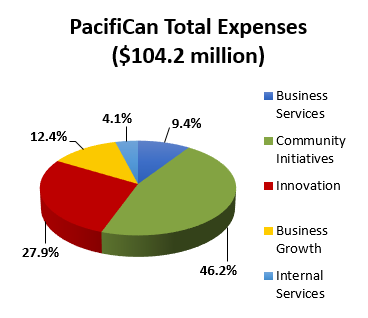
Text version: PacifiCan Total Expenses ($104.2 million) chart
| Community Initiatives | Innovation | Business Growth | Business Services | Internal Services |
|---|---|---|---|---|
| 46.2% | 27.9% | 12.4% | 9.4% | 4.1% |
Total expenses for PrairiesCan were $281.8 million in 2021-22, a net decrease of $282.0 million (50 percent) over 2020-21. This year-over-year net decrease is attributed primarily to reductions in transfer payment expenses under the Regional Recovery and Relief Fund ($286.1 million), Canadian Seafood Processor’s Fund ($11.3 million), Western Diversification Program ($14.8 million), the Canadian Experiences Fund ($7.5 million), and the restoration of the Hudson Bay rail line and reopening of the Port of Churchill ($5.0 million); offset by new programming for the Canada Community Revitalization Fund ($13.7 million), Regional Air Transportation ($10.9 million), and Major Festivals and Events ($8.4 million) and ongoing funding for Regional Innovation Ecosystems ($12.9 million).
Total expenses for PacifiCan were $104.2 million in 2021-22. This is attributed primarily to transfer payment expenses under the Regional Innovation Ecosystem ($24.6 million), the Western Diversification Program ($15.7 million), and Community Futures and network partners ($7.4 million), augmented with new programming for time limited initiatives such as the Regional Air Transportation Initiative ($19.2 million), the Regional Recovery and Relief Fund ($9.2 million), the Canada Community Revitalization Fund ($7.8 million), Major Festivals and Events ($3.0 million), and other programming, operating and maintenance, and adjustments ($17.3 million).
Condensed Statement of Financial Position (unaudited) as of March 31, 2022 (dollars)
PrairiesCan:
| Financial information | 2021–2022 | 2020–2021 | Difference (2021–2022 minus 2020–2021) |
|---|---|---|---|
| Total net liabilities | 134,197,412 | 113,295,658 | 20,901,754 |
| Total net financial assets | 130,706,087 | 109,126,445 | 21,579,642 |
| Departmental net debt | 3,491,325 | 4,169,213 | (677,888) |
| Total non-financial assets | 1,931,984 | 1,711,082 | 220,902 |
| Departmental net financial position | (1,559,341) | (2,458,131) | 898,790 |
PacifiCan:
| Financial information | 2021–2022 | 2020–2021 | Difference (2021–2022 minus 2020–2021) |
|---|---|---|---|
| Total net liabilities | 77,162,653 | Not Available1 | Not Available1 |
| Total net financial assets | 76,235,532 | Not Available1 | Not Available1 |
| Departmental net debt | 927,121 | Not Available1 | Not Available1 |
| Total non-financial assets | 7,134 | Not Available1 | Not Available1 |
| Departmental net financial position | (919,987) | Not Available1 | Not Available1 |
Note 1: Information not available prior to the establishment of PacifiCan.

Text version: PrairiesCan total net liabilities ($134.2 million) chart
| Accounts payable and accrued liabilities | Vacation pay and compensatory leave | Employee future benefits |
|---|---|---|
| 97.4% | 2.0% | 0.6% |

Text version: PacifiCan total net liabilities ($77.2 million) chart
| Accounts payable and accrued liabilities | Vacation pay and compensatory leave | Employee future benefits |
|---|---|---|
| 98.8% | 1.0% | 0.2% |
Total net liabilities were $134.2 million at the end of 2021–22, a net increase of $20.9 million (18 percent) over 2020–21. This year-over-year net increase is attributed to the establishment of accounts payable balances for the Regional Recovery and Relief Fund and the Regional Innovation Ecosystem (RIE) program. The total net liabilities for PrairiesCan are in addition to net liabilities of $77.2 million for PacifiCan in 2021–22.

Text version: PrairiesCan total net financial assets ($130.7 million) chart
| Due from Consolidated Revenue Fund | Accounts receivable and advances |
|---|---|
| 99.9% | 0.1% |

Text version: PacifiCan total net financial assets ($76.2 million) chart
| Due from Consolidated Revenue Fund | Accounts receivable and advances |
|---|---|
| 99.8% | 0.2% |
Total net financial assets were $130.7 million at the end of 2021–22, an increase of $21.6 million (20 percent) over 2020–21. This year-over-year increase in these assets primarily consists of the Due from Consolidated Revenue Fund which is used to discharge PrairiesCan’s liabilities, off-set by a decrease in Accounts Receivable and Advances. Given PrairiesCan’s liabilities were higher than the previous fiscal year, the amount Due from Consolidated Revenue Fund also increased. The total net financial assets for PrairiesCan are in addition to net financial assets of $76.2 million for PacifiCan in 2021–22.
Corporate Information
Organizational profile
Appropriate ministers:
The Honourable Dan Vandal, P.C., M.P.
The Honourable Harjit S. Sajjan, P.C., OMM, MSM, CD, M.P.
Institutional heads:
Dylan Jones (President of PacifiCan and Interim President of PrairiesCan until October 30, 2022)
Diane Gray (President of PrairiesCan, effective October 31, 2022)
Ministerial portfolios:
The Honourable Dan Vandal: Prairies Economic Development Canada, Northern Affairs, Canadian Northern Economic Development Agency
The Honourable Harjit S. Sajjan: Pacific Economic Development Agency of Canada, International Development
Enabling instrument(s):
Western Economic Diversification Act, R.S.C. 1985, c.11, (4th Supplement)
Year of incorporation / commencement:
1987
Other information:
Headquarters: Edmonton, Alberta (WD/PrairiesCan) and Surrey, British Columba (PacifiCan)
Service locations:
As of March 2022, PrairiesCan and PacifiCan had established offices in the following communities:
British Columbia: Vancouver
Alberta: Edmonton and Calgary
Saskatchewan: Saskatoon
Manitoba: Winnipeg
Ontario: Ottawa
In 2021-22, PrairiesCan and PacifiCan commenced the expansion of service locations to also include the following communities:
Alberta: Lethbridge, Fort McMurray, Grande Prairie
Saskatchewan: Regina, Prince Albert
Manitoba: Thompson, Brandon
British Columbia: Victoria, Kelowna, Prince George, Cranbrook, Fort St. John, Prince Rupert, Campbell River, Surrey
Raison d’être, mandate and role: who we are and what we do
“Raison d’être, mandate and role: who we are and what we do” is available on WD’s website and PacifiCan’s website.
For more information on PrairiesCan’s and PacifiCan’s organizational mandate letter commitments, see the Ministers’ mandate letters.
Reporting framework
WD’s Departmental Results Framework (DRF) and Program Inventory (PI) of record for 2021–22 are shown below.
|
Departmental Results Framework |
Core Responsibility: Economic development in Western Canada |
Internal Services |
|
|
Departmental result: Businesses are innovative and growing in Western Canada |
Indicator: Value of exports of goods from Western Canada ($) |
||
|
Indicator: Number of high-growth firms in Western Canada |
|||
|
Indicator: Value of exports of clean technologies from Western Canada ($) |
|||
|
Indicator: Revenue growth rate of firms supported by WD programs |
|||
|
Departmental result: Communities are economically diversified in Western Canada |
Indicator: Percentage of SMEs that are majority-owned by women, Indigenous people, youth, visible minorities and persons with disabilities in Western Canada |
||
|
Indicator: Amount leveraged per dollar by WD in community projects |
|||
|
Departmental result: Businesses invest in the development and commercialization of innovative technologies in Western Canada |
Indicator: Value of business expenditures in research and development by firm receiving WD program funding ($) |
||
|
Indicator: Percentage of professional jobs (including science and technology) in Western Canada |
|||
|
Indicator: Percentage of companies engaged in collaborations with higher education institutions in Western Canada |
|||
|
Program Inventory |
Program: Innovation |
||
|
Program: Business Growth |
|||
|
Program: Business Services |
|||
|
Program: Community Initiatives |
|||
Note: From August 6, 2021 to March 31, 2022, PacifiCan used a DRF and PI that was consistent with WD’s (presented above) on an interim basis until its DRF and PI officially came into effect on April 1, 2022. PacifiCan reported expenditures for 2021-22 through the Public Accounts consistent with the program inventory listed above
Supporting information on the program inventory
Financial, human resources and performance information for WD’s Program Inventory is available in GC InfoBase.
Supplementary information tables
The following supplementary information tables are available on WD’s website:
- Reporting on Green Procurement
- Details on transfer payment programs
- Gender-based analysis plus
- Response to Parliamentary Committee and External Audits
- Up-front multi-year funding
Federal tax expenditures
The tax system can be used to achieve public policy objectives through the application of special measures such as low tax rates, exemptions, deductions, deferrals and credits. The Department of Finance Canada publishes cost estimates and projections for these measures each year in the Report on Federal Tax Expenditures. This report also provides detailed background information on tax expenditures, including descriptions, objectives, historical information and references to related federal spending programs as well as evaluations and GBA+ of tax expenditures.
Organizational contact information
PrairiesCan
Mailing address:
Suite 1500, 9700 Jasper Avenue, Edmonton, Alberta T5J 4H7
Telephone:
780-495-4164 / Toll Free 1-888-338-WEST (9378)
Fax:
780-495-4557
Email:
WD.contactus-contactez-nous.DEO@canada.ca
Web:
Prairies Economic Development Canada – Canada.ca
PacifiCan
Mailing address:
1300-300 West Georgia Street, Vancouver, BC V6B 6B4
Telephone:
604-666-6256 / Toll Free: 1-888-338-9378
Fax:
604-666-2353
Email:
info@pacifican.gc.ca
Web:
Pacific Economic Development Canada - Canada.ca
Appendix: definitions
appropriation (crédit)
Any authority of Parliament to pay money out of the Consolidated Revenue Fund.
budgetary expenditures (dépenses budgétaires)
Operating and capital expenditures; transfer payments to other levels of government, organizations or individuals; and payments to Crown corporations.
core responsibility (responsabilité essentielle)
An enduring function or role performed by a department. The intentions of the department with respect to a core responsibility are reflected in one or more related departmental results that the department seeks to contribute to or influence.
Departmental Plan (plan ministériel)
A report on the plans and expected performance of an appropriated department over a 3-year period. Departmental Plans are usually tabled in Parliament each spring.
departmental priority (priorité)
A plan or project that a department has chosen to focus and report on during the planning period. Priorities represent the things that are most important or what must be done first to support the achievement of the desired departmental results.
departmental result (résultat ministériel)
A consequence or outcome that a department seeks to achieve. A departmental result is often outside departments’ immediate control, but it should be influenced by program-level outcomes.
departmental result indicator (indicateur de résultat ministériel)
A quantitative measure of progress on a departmental result.
departmental results framework (cadre ministériel des résultats)
A framework that connects the department’s core responsibilities to its departmental results and departmental result indicators.
Departmental Results Report (rapport sur les résultats ministériels)
A report on a department’s actual accomplishments against the plans, priorities and expected results set out in the corresponding Departmental Plan.
experimentation (expérimentation)
The conducting of activities that seek to first explore, then test and compare the effects and impacts of policies and interventions in order to inform evidence-based decision-making, and improve outcomes for Canadians, by learning what works, for whom and in what circumstances. Experimentation is related to, but distinct from innovation (the trying of new things), because it involves a rigorous comparison of results. For example, using a new website to communicate with Canadians can be an innovation; systematically testing the new website against existing outreach tools or an old website to see which one leads to more engagement, is experimentation.
full-time equivalent (équivalent temps plein)
A measure of the extent to which an employee represents a full person-year charge against a departmental budget. For a particular position, the full-time equivalent figure is the ratio of number of hours the person actually works divided by the standard number of hours set out in the person’s collective agreement.
gender-based analysis plus (GBA+) (analyse comparative entre les sexes plus [ACS+])
An analytical process used to assess how diverse groups of women, men and gender-diverse people experience policies, programs and services based on multiple factors including race ethnicity, religion, age, and mental or physical disability.
government-wide priorities (priorités pangouvernementales)
For the purpose of the 2019–2020 Departmental Results Report, those high-level themes outlining the government’s agenda in the 2019 Speech from the Throne, namely: Fighting climate change; Strengthening the Middle Class; Walking the road of reconciliation; Keeping Canadians safe and healthy; and Positioning Canada for success in an uncertain world.
horizontal initiative (initiative horizontale)
An initiative where two or more federal organizations are given funding to pursue a shared outcome, often linked to a government priority.
non-budgetary expenditures (dépenses non budgétaires)
Net outlays and receipts related to loans, investments and advances, which change the composition of the financial assets of the Government of Canada.
performance (rendement)
What an organization did with its resources to achieve its results, how well those results compare to what the organization intended to achieve, and how well lessons learned have been identified.
performance indicator (indicateur de rendement)
A qualitative or quantitative means of measuring an output or outcome, with the intention of gauging the performance of an organization, program, policy or initiative respecting expected results.
performance reporting (production de rapports sur le rendement)
The process of communicating evidence-based performance information. Performance reporting supports decision making, accountability and transparency.
plan (plan)
The articulation of strategic choices, which provides information on how an organization intends to achieve its priorities and associated results. Generally, a plan will explain the logic behind the strategies chosen and tend to focus on actions that lead to the expected result.
planned spending (dépenses prévues)
For Departmental Plans and Departmental Results Reports, planned spending refers to those amounts presented in Main Estimates.
A department is expected to be aware of the authorities that it has sought and received. The determination of planned spending is a departmental responsibility, and departments must be able to defend the expenditure and accrual numbers presented in their Departmental Plans and Departmental Results Reports.
program (programme)
Individual or groups of services, activities or combinations thereof that are managed together within the department and focus on a specific set of outputs, outcomes or service levels.
program inventory (répertoire des programmes)
Identifies all the department’s programs and describes how resources are organized to contribute to the department’s core responsibilities and results.
result (résultat)
A consequence attributed, in part, to an organization, policy, program or initiative. Results are not within the control of a single organization, policy, program or initiative; instead they are within the area of the organization’s influence.
statutory expenditures (dépenses législatives)
Expenditures that Parliament has approved through legislation other than appropriation acts. The legislation sets out the purpose of the expenditures and the terms and conditions under which they may be made.
target (cible)
A measurable performance or success level that an organization, program or initiative plans to achieve within a specified time period. Targets can be either quantitative or qualitative.
voted expenditures (dépenses votées)
Expenditures that Parliament approves annually through an appropriation act. The vote wording becomes the governing conditions under which these expenditures may be made.
- Date modified: